BOSTON COLLEGE POST-GRADUATION PLANS SURVEY CLASS OF 2012
advertisement
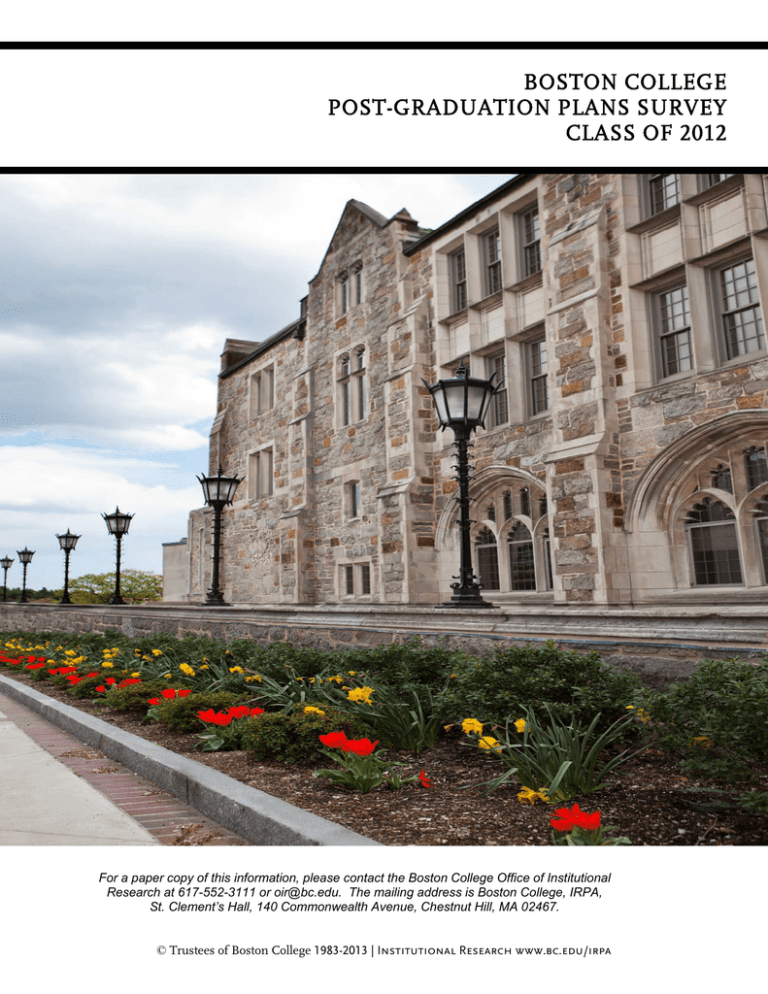
BOSTON COLLEGE POST-GRADUATION PLANS SURVEY CLASS OF 2012 For a paper copy of this information, please contact the Boston College Office of Institutional Research at 617-552-3111 or oir@bc.edu. The mailing address is Boston College, IRPA, St. Clement’s Hall, 140 Commonwealth Avenue, Chestnut Hill, MA 02467. © Trustees of Boston College 1983-2013 | Institutional Research www.bc.edu/irpa BOSTON COLLEGE POST-GRADUATION PLANS SURVEY CLASS OF 2012 EXECUTIVE SUMMARY The purpose of the Boston College Post-Graduation Plans Survey is to track recent graduates’ future plans via topics such as their primary activity six months post-graduation, top career fields, the timing of offers and starting salary information, graduate school enrollment by program, degree, and institution, and the organizations where recent graduates choose to volunteer, among other areas. The information collected from graduating seniors provides valuable data for faculty, administrators, and employers to better serve students in their career-planning activities. Survey administration Administered March 2012 through October 2012 to all members of the undergraduate Class of 2012 Online administration 1,535 respondents (69% response rate) Survey highlights Approximately 95% of those responding to the Class of 2012 Post-Graduation Plans Survey indicate that they plan to work full-time, attend graduate school full-time, volunteer, or engage in a fellowship or post-graduation internship. The median salary reported by members of the Class of 2012 is $52,500 with the middle 50% of students reporting salaries between $40,000 and $60,000. Of those respondents who have accepted a full-time job offer, half are employed in one of the following fields: Marketing, Public Auditing/Accounting, Consulting, Finance, or Teaching. Almost one-fifth (19.5%) of survey respondents indicate that they are/will be pursuing a graduate degree full-time; less than 1% are enrolled in part-time graduate study. Among recent graduates pursuing advanced degrees, close to one-quarter (24.5%) are pursuing law degrees and another fifth (19.9%) are pursuing education degrees. RESPONSE RATES BY SCHOOL The online administration of the survey generated responses from more than two thirds of the Class of 2012; the Lynch School of Education (LSOE) had the highest response rate (75%) followed by the Connell School of Nursing (CSON) with a 72% response rate. Number surveyed Number of respondents Response rate College of Arts & Sciences (A&S) 1483 1022 68.9% Carroll School of Management (CSOM) 453 301 66.4% Connell School of Nursing (CSON) 101 73 72.3% Lynch School of Education (LSOE) 185 139 75.1% 2,222 1,535 69.1% School Total PRIMARY ACTIVITY SIX MONTHS FOLLOWING GRADUATION Approximately 95% of those responding to the Class of 2012 Post-Graduation Plans Survey indicate that they plan to work full-time, attend graduate school, volunteer, or engage in a fellowship or post-graduation internship; the distribution of post-graduation status, however, varies substantially among schools. A total of 61.0% of respondents report that they plan to work full-time. CSON graduates are the most likely to be working for pay (87.7%), followed closely by CSOM graduates (87.0%). More than one-quarter of A&S and nearly half of LSOE graduates are attending graduate school and approximately 7% of both A&S and LSOE graduates report that they are volunteering. Class of 2012, Primary activity A&S CSOM CSON LSOE All Schools Working full-time for pay 54.5% 87.0% 87.7% 38.8% 61.0% Attending graduate, law, or medical school 26.1% 7.0% 6.8% 46.0% 23.3% Working as a volunteer 6.8% 1.0% 1.4% 7.2% 5.5% Participating in a post-graduate internship 4.5% 2.3% - 1.4% 3.6% Participating in a fellowship, research grant, etc. 1.5% - - 2.2% 1.2% Other 6.6% 2.7% 4.1% 4.3% 5.5% Total 100% 100% 100% 100% 100% Activity Post-Graduation Plans Survey Class of 2012 | Page 2 | Office of Institutional Research | February 2013 Primary activity of Class of 2012 graduates six months post graduation Participating in a post-graduate internship, 3.6% Other, 5.5% Participating in a fellowship, scholarship, grant, etc., 1.2% Attending graduate, law or medical school, 23.3% Working full time for pay, 61.0% Working as a volunteer, 5.5% Trends, Primary activity The percent of graduates reporting they plan to work full-time has increased from the previous two years, but is still less than 2008 levels. The percent planning to attend graduate school remained level since 2011. Activity 2008 2009 2010 2011 2012 Working full-time for pay 64.5% 58.7% 55.9% 59.8% 61.0% Attending graduate, law, or medical school 22.1% 24.5% 28.1% 23.1% 23.3% Working as a volunteer 5.2% 5.3% 6.6% 4.8% 5.5% Participating in a post-graduate internship 1.5% 2.3% 2.6% 2.8% 3.6% Participating in a fellowship, research grant, etc. 1.3% 3.1% 1.9% 2.3% 1.2% Other 5.4% 6.1% 4.8% 7.3% 5.5% Total 100% 100% 100% 100% 100% Post-Graduation Plans Survey Class of 2012 | Page 3 | Office of Institutional Research | February 2013 TOP TEN CAREER FIELDS Topping the list of career fields reported by 2012 graduates are consulting and teaching (10.8% and 9.8% of respondents who reported their field of employment, respectively). Class of 2012, Top ten employment fields Total number reporting (N=511) Percent of total # reporting Consulting 55 10.8% Teaching 50 9.8% Accounting (Public) 30 5.9% Auditing (Public) 26 5.1% Marketing – Sales 24 4.7% Financial/Treasury Analysis 22 4.3% Registered Nurse 20 3.9% Research (Technical/Scientific) 20 3.9% Portfolio Management/Brokerage 19 3.7% Investment Banking (Corporate Finance) 17 3.3% Employment field Class of 2012, Top employment fields by school A&S Employment Field Teaching Consulting Research (Technical/Scientific) Paralegal Marketing - Sales CSOM N 42 29 19 16 13 % 15% 11% 7% 6% 5% Employment Field Accounting (Public) Auditing (Public) Consulting Financial/Treasury Analysis Corporate Finance LSOE Employment Field Teaching Advertising Customer Service Sales Consulting Human Resources N 27 26 24 17 14 % 14% 13% 12% 9% 7% N 20 1 % 95% 5% CSON N 6 2 2 2 2 2 % 30% 10% 10% 10% 10% 10% Employment Field Registered Nurse Teaching Post-Graduation Plans Survey Class of 2012 | Page 4 | Office of Institutional Research | February 2013 TOP EMPLOYERS With regard to the companies and organizations hiring the greatest number of recent BC graduates, there is representation across a variety of employers, although those in the fields of accounting, financial services, and nursing, along with Teach for America, dominate the list of top employers. Class of 2012, Top employers (all companies/organizations employing at least five graduates are listed) Employer Total # employed Total # employed Employer PricewaterhouseCoopers 34 JPMorgan Chase 8 Teach for America 31 Epic Systems 6 Ernst and Young 16 General Electric 6 Deloitte Consulting 13 Liberty Mutual 6 KPMG 13 EMC Corporation 5 Barclays Capital 10 Epsilon 5 Citigroup 8 Wayfair 5 TIMING OF EMPLOYMENT OFFERS Of those graduates who indicated they intend to work full time, 62% had received an offer of employment. Among students who have received an offer of employment, the majority of full-time employed respondents had secured their positions prior to graduation; however, there was variation in the timing of offers across the colleges. (Note: “Employment field” labels are supplied by the National Association of Colleges & Employers.) Class of 2012, Timing of employment offers by school Time Period A&S CSOM CSON LSOE All Schools Prior to senior year 12.3% 37.9% 9.1% - 21.1% First semester senior year 22.1% 34.6% 4.5% 16.0% 25.8% Second semester senior year 48.6% 17.8% 54.5% 48.0% 37.4% Summer following senior year 14.8% 8.4% 31.8% 28.0% 13.7% Fall following senior year 2.2% 1.4% - 8.0% 2.1% Total 100% 100% 100% 100% 100% Post-Graduation Plans Survey Class of 2012 | Page 5 | Office of Institutional Research | February 2013 Class of 2012, Timing of employment offers by field of employment Prior to Senior Year First Semester Senior Year Second Semester Senior Year After Senior Year Accounting/Auditing (Private) (N=14) 35.7% 35.7% 7.1% 21.4% Accounting/Auditing (Public) (N=56) 73.2% 23.2% 3.6% - Commercial Banking (N=13) - 69.2% 15.4% 15.4% Communications (N=17) - 5.9% 64.7% 29.4% Computer Science (N=21) 19.0% 38.1% 23.8% 19.0% Consulting (N=55) 16.4% 49.1% 25.5% 9.1% Finance (Other) (N=50) 28.0% 34.0% 36.0% 2.0% Healthcare (Other) (N=16) 12.5% 6.3% 50.0% 31.3% Human Resources (N=9) 22.2% 11.1% 33.3% 33.3% Investment Banking (N=46) 50.0% 34.8% 6.5% 8.7% - 40.0% 50.0% 10.0% Marketing (N=67) 7.5% 19.4% 37.3% 35.9% Paralegal (N=16) - 6.3% 43.8% 50.0% Public Administration (N=13) 53.8% 23.1% 7.7% 15.4% Registered Nurse (N=20) 10.0% 5.0% 50.0% 35.0% - 13.6% 72.7% 13.6% Social Services (N=9) 11.1% - 88.9% - Teaching (N=50) 2.0% 26.0% 66.0% 6.0% Other (N=7) 14.3% - 28.6% 57.1% Employment field Management (Trainee or General) (N=10) Research (N=22) Post-Graduation Plans Survey Class of 2012 | Page 6 | Office of Institutional Research | February 2013 PRIMARY RESOURCES USED TO OBTAIN CURRENT POSITION Thirty-eight percent of the respondents who are working full-time indicated that they found their position through on-campus interviewing or other Career Center programs. This represents a decline from the Class of 2011 (47.8%) but is comparable to earlier years: from 2008 to 2010 between 35-40% found their positions in that manner. The percent who noted networking or internships as their primary resource increased to about 35%, up from 28% for the Class of 2011 but comparable to the previous three classes. Note that the BC Career Center provides many networking and internship opportunities. Class of 2012, Primary resources used to obtain current position A&S CSOM CSON LSOE All Schools EagleLink on-campus interviews 15.8% 49.2% - - 27.5% Other EagleLink listings 8.5% 3.0% - 5.0% 5.9% Listings linked through Career Center website 1.1% 0.5% - - 0.8% Other job listings (e.g., Internet, print) 15.1% 5.6% 14.3% 15.0% 11.4% Career fair at BC 3.3% 3.6% 9.5% - 3.5% Career fair outside of BC 0.4% 0.5% - - 0.4% Career Center program 0.4% - - 5.0% 0.4% Networking 22.8% 17.8% 33.3% 30.0% 21.6% Internship 13.2% 14.2% 19.0% 15.0% 13.9% Family business 0.7% 0.5% - - 0.6% Employment agency 0.4% 1.0% - - 0.6% Other 18.4% 4.1% 23.8% 30.0% 13.5% Total 100% 100% 100% 100% 100% Resources Post-Graduation Plans Survey Class of 2012 | Page 7 | Office of Institutional Research | February 2013 Class of 2012, Primary resources used to obtain current position by field of employment Employment field N EagleLink oncampus Networking interviews Other Career Other job listings Internship Center/Eagle (e.g., print, Link Program Internet) Other Accounting/Auditing (Private) 14 42.9% 14.3% 35.7% - 7.1% - Accounting/Auditing (Public) 56 64.3% 8.9% 19.6% 5.4% - 1.8% Commercial Banking 13 61.5% 7.7% 7.7% 7.7% - 15.4% Communications 16 - 18.8% 31.3% 12.5% 25.0% 12.5% Computer Science 21 28.6% 4.8% 19.0% 9.5% 28.6% 9.5% Consulting 55 50.9% 16.4% 1.8% 12.7% 10.9% 7.3% Finance (Other) 50 42.0% 16.0% 16.0% 12.0% 6.0% 8.0% Healthcare (Other) 16 6.3% 31.3% - 31.3% 18.8% 12.5% Human Resources 9 - 22.2% 22.2% - 22.2% 33.3% Investment Banking 46 43.5% 23.9% 17.4% 4.3% 2.2% 8.7% Management (Trainee or General) 10 30.0% 40.0% 0.0% 10.0% 10.0% 10.0% Marketing 67 11.9% 35.8% 13.4% 11.9% 10.4% 16.4% Paralegal 16 12.5% 12.5% 6.3% 50.0% 6.3% 12.5% Public Administration 13 7.7% 7.7% 7.7% 7.7% 15.4% 53.8% Registered Nurse 20 - 35.0% 20.0% 10.0% 15.0% 20.0% Research 22 - 27.3% 36.4% 4.5% 18.2% 13.6% Social Services 9 - 33.3% 11.1% 11.1% 11.1% 33.3% Teaching 50 - 26.0% 2.0% 8.0% 24.0% 40.0% Other 7 - 42.9% 14.3% - 14.3% 28.6% Total 510 27.5% 21.6% 13.9% 10.6% 11.4% 15.1% MEDIAN STARTING SALARIES BY SCHOOL Salary information was provided by 85.7% of students who had accepted a job offer. Reported salaries ranged from $40,000 at the 25th percentile to $60,000 at the 75th percentile, with a median salary for all responding students of $52,500. These values have remained fairly steady since last year. Class of 2012, Starting salaries by school Salary Range CSOM 236 188 Median salary $40,750 $56,000 $56,000 $36,250 $52,500 25th percentile of range $35,000 $54,000 $50,000 $30,000 $40,000 75th percentile of range $55,000 $65,000 $68,000 $43,964 $60,000 Number reporting CSON 19 LSOE All Schools A&S 18 461 Post-Graduation Plans Survey Class of 2012 | Page 8 | Office of Institutional Research | February 2013 MEDIAN STARTING SALARIES BY FIELD Among the top career fields by number of survey respondents employed, the highest median starting salaries are in the fields of investment banking. Research (Technical/Scientific) had the lowest median starting salary of the group at $32,500. Class of 2012, Median salaries by top ten fields of employment Number reporting Median salary Investment Banking (Corporate Finance) 17 $70,000 $55,000 - $85,000 Portfolio Management/Brokerage 15 $65,000 $40,000 - $140,000 Consulting 52 $63,000 $30,000 - $72,000 Registered Nurse 18 $56,000 $50,000 - $77,285 Accounting (Public) 30 $55,000 $35,000 - $63,000 Auditing (Public) 26 $55,000 $48,000 - $65,000 Financial/Treasury Analysis 21 $55,000 $20,000 - $70,000 Marketing - Sales 21 $45,000 $30,000 - $65,000 Teaching 48 $35,000 $7,500 - $50,000 Research (Technical/Scientific) 16 $32,500 $27,000 - $62,000 Employment field Salary range Median salaries by top ten fields of employment $80,000 $60,000 $40,000 $20,000 $0 Post-Graduation Plans Survey Class of 2012 | Page 9 | Office of Institutional Research | February 2013 Class of 2012, Reported starting salaries by field of employment Employment field/job type N Median Minimum Maximum Finance Accounting (Private) Accounting (Public) Auditing (Private)* Auditing (Public) Commercial Banking (Consumer)* Commercial Banking (Lending) Consulting Financial/Treasury Analysis Insurance (Claims)* Insurance (Underwriting)* Investment Banking (Corp Finance) Investment Banking (Mergers & Acquisitions) Investment Banking (Real Estate)* Investment Banking (Sales & Trading) Management Trainee (Entry-Level) Management, General (Mid to Upper Level)* Portfolio Management/Brokerage 229 9 30 4 26 2 10 52 21 4 5 17 14 2 9 7 2 15 $57,000 54,000 55,000 $20,000 35,000 35,000 $140,000 70,000 63,000 55,000 48,000 65,000 55,000 63,000 55,000 32,000 30,000 20,000 60,000 72,000 70,000 70,000 70,000 55,000 60,000 85,000 125,000 70,000 54,000 27,000 30,000 80,000 66,000 65,000 40,000 140,000 Public Administration Executive, Legislative & General* National Security* Military 11 2 1 8 $36,000 $2,400** $60,000 35,500 2,400** 60,000 Computer Science Computer Programming Technical/Computer Support* Other Computer Related 19 12 1 6 $57,000 62,000 $35,000 50,000 $100,000 100,000 55,000 45,000 63,000 Social Services Administrative (Social Services)* Development/Fundraising (Social Services)* Social Work* 7 2 2 3 $23,000 $7,500** $40,000 Healthcare Administrative (Healthcare)* Medical Technology* Registered Nurse Other Health Related 32 4 3 18 7 $53,570 $10,000** $77,285 56,000 26,000 50,000 10,000** 77,285 38,500 * Salary data are only presented for fields with more than five cases. **Salaries under $15,000/year included Peace Corp, US Air Force, Theatre Intern, City Year Corps Member. Post-Graduation Plans Survey Class of 2012 | Page 10 | Office of Institutional Research | February 2013 Employment field/job type N Median Minimum Maximum Marketing Advertising Brand/Product Management Buyer/Merchandising Customer Service* Marketing Research Sales 58 9 8 10 2 8 21 $45,000 38,000 50,000 47,500 $25,000 30,000 35,000 25,000 $65,000 46,000 65,000 55,000 45,000 45,000 31,000 30,000 45,000 65,000 Communications Design/Graphic Arts* Public Relations Writing/Editing* 14 3 8 3 $35,000 $29,000 $45,000 35,000 30,000 40,000 Other 91 2 7 13 3 2 16 48 $35,000 $1,440** $65,000 42,000 40,000 32,000 30,000 55,000 65,000 32,500 35,000 27,000 7,500** 62,000 50,000 Actuarial* Human Resources/Industrial Relations Paralegal Performing Arts* Research (Nontechnical)* Research (Technical/Scientific) Teaching *Salary data are only presented for fields with more than five cases. **Salaries under $15,000/year included Peace Corp, US Air Force, Theatre Intern, City Year Corps Member. Post-Graduation Plans Survey Class of 2012 | Page 11 | Office of Institutional Research | February 2013 GEOGRAPHIC LOCATION OF EMPLOYED GRADUATES While the majority of survey respondents reported employment in the Northeast, all areas of the United States were represented. An increase in international destinations was noted, with graduates employed in Belgium, Hong Kong, Israel, Japan, Korea, Nepal, and Taiwan. This geographic distribution is somewhat more diverse than in previous years. West, 3.8% International, 2.0% Mid-Atlantic, 6.2% Southwest, 4.2% Midwest, 6.2% South, 3.0% Northeast, 74.5% Trends in Geographic Location Region International Mid-Atlantic Midwest Northeast South Southwest West 2008 1.2% 5.3% 3.9% 79.9% 2.2% 2.0% 5.1% 2009 2.4% 7.3% 6.1% 77.4% 2.8% 1.2% 2.6% 2010 2.3% 9.1% 5.8% 74.3% 2.6% 2.1% 3.7% 2011 0.3% 5.7% 5.1% 80.0% 4.1% 2.4% 2.4% 2012 2.0% 6.2% 6.2% 74.5% 3.0% 4.2% 3.8% Post-Graduation Plans Survey Class of 2012 | Page 12 | Office of Institutional Research | February 2013 GRADUATE SCHOOL ENROLLMENT BY PROGRAM/DEGREE TYPE Almost one-fifth (19.5%) of the survey’s respondents indicated that they are currently pursuing graduate degrees full-time. In addition, 5.6% of survey respondents plan to enroll in graduate school part-time (this includes students who plan to work full-time). Of the respondents reporting a degree program, one quarter are pursuing law degrees (24.5%) and one fifth are pursuing education degrees (19.9%). Class of 2012, Distribution of graduate program enrollments Number reporting Percent of respondents Master’s Degrees Education (M.A., M.A.T., M.Ed.) Humanities or Social Sciences (M.A., Other) Business (M.S., M.B.A.) Health, Policy, or Planning (M.P.H., M.P.P., M.P.A) Fine and Performing Arts (M.A., M.M., M.F.A.) Natural/Applied Science or Math (M.A., M.S.) Social Work (M.S.W.) Communications (M.A., M.S.) Nursing (M.S.) Other Master’s (M.A., P.A.) Counseling (M.A.) 61 30 22 15 9 8 8 7 7 3 2 19.9% 9.8% 7.2% 4.9% 2.9% 2.6% 2.6% 2.3% 2.3% 1.0% 0.7% Ph.D. Sciences or Math Applied Doctorates (D.P.T., Pharm.D., Psy.D., etc.) Humanities or Social Sciences 12 7 6 3.9% 2.3% 2.0% J.D. 75 24.5% M.D. D.D.S./D.M.D. D.V.M. Total 21 8 5 306 6.9% 2.6% 1.6% 100.0% Graduate Degrees *Students in joint degree programs are listed by the highest degree they are planning to obtain. Post-Graduation Plans Survey Class of 2012 | Page 13 | Office of Institutional Research | February 2013 GRADUATE SCHOOLS OF ATTENDANCE The array of institutions attended by Class of 2012 graduates varies by the degree and field of study pursued. Listed below is a sample of the graduate schools currently being attended by members of the Class of 2012, by primary field of study (number of students enrolled is included in parentheses). (Note: these data are selfreported by survey respondents – they are not supplied by the institution. Enrollment numbers include full- and part-time students.) Sample of graduate schools of attendance by the Class of 2012 Law Medicine Boston College Law School (8) Tufts University School of Medicine (2) Suffolk University Law School (5) Boston University (2) Georgetown University (4) Emory University (1) St. John’s University (4) University of Chicago (1) Columbia University (3) University of Massachusetts (1) Fordham University (3) Education Natural and Applied Sciences Boston College (50) Boston College (1) Harvard University (2) Georgetown University (1) Vanderbilt University (2) New York University (1) Boston University (1) Scripps Research Institute (1) New York University (1) University of Wisconsin (1) Social Sciences Social Work Boston College (3) Boston College (3) Boston University (1) Fordham University (1) Duke University (1) Loyola University Chicago (1) Trinity College (1) Humanities Business Boston College (7) Boston College (10) Columbia University (2) Boston University (1) University of Chicago (1) Columbia University (1) Yale University (1) Massachusetts Institute of Technology (1) Post-Graduation Plans Survey Class of 2012 | Page 14 | Office of Institutional Research | February 2013 VOLUNTEER ORGANIZATIONS Comparable to the results for the Class of 2011, 5.5% of the Class of 2012 members indicated that they are volunteering following their Boston College graduation. While volunteer sites were both domestic and international, the highest proportion of students are volunteering with the Jesuit Volunteer Corps. Class of 2012, Organizations for which graduates are volunteering full-time Number reporting Percent of respondents Jesuit Volunteer Corps 20 37.7% City Year 7 13.2% Americorps 3 5.7% Alumni Service Corps 1 1.9% Bon Secours 1 1.9% Change a Heart Franciscan Volunteers 1 1.9% Chicago Alliance Against Sexual Exploitation 1 1.9% College Possible 1 1.9% Community Water Solutions 1 1.9% Convent of Mercy Academy 1 1.9% FrancisCorps 1 1.9% Gamboula Hospital - CAR 1 1.9% Jesuit College Prepatory School 1 1.9% Jovenes, Inc. 1 1.9% New England Coastal Wildlife Alliance 1 1.9% NM Appleseed 1 1.9% Nuestros Pequenos Hermanos 1 1.9% Sea Education Association 1 1.9% Society of St. John the Evangelist 1 1.9% St. Joseph's Prep Alumni Service Corps 1 1.9% United States Peace Corps 1 1.9% University of Miami School of Medicine 1 1.9% Venture South 1 1.9% Working Boys' Center 1 1.9% WorldTeach 1 1.9% Xavier High School 1 1.9% Total 53 100% Organization Post-Graduation Plans Survey Class of 2012 | Page 15 | Office of Institutional Research | February 2013 INTERNSHIPS Fifty-five members of the Class of 2012 reported that they have secured post-graduation internships. The internships range in duration from six weeks to two years. Class of 2012, Internship duration Time Frame Number reporting Percent of respondents Less than 3 months 5 14.3% 3 months 4 months 6 months 1 academic year 1 calendar year 10 3 2 7 7 28.6% 8.6% 5.7% 20.0% 20.0% 2 years 1 2.9% Total 35 100% Class of 2012, Organizations where graduates are interning for at least six months Organization Actors Theatre Bahia Vista Elementary School Boston College Athletics Brigham and Women's Hospital Brookline Public Schools Children's Hospital Boston ESPN Global Nomads Group Lucile Packard Children's Hospital MiH Jeans Museum of Contemporary Art National Institute of Health Sol-Solution The Walt Disney Company University of Missouri USA Hockey World Affairs Council of Americas Total Number reporting 1 1 1 1 1 1 1 1 1 1 1 1 1 1 1 1 1 17 Post-Graduation Plans Survey Class of 2012 | Page 16 | Office of Institutional Research | February 2013 FELLOWSHIPS Of the survey respondents from the Class of 2012, 18 reported that they have been accepted into a fellowship program. The following table lists the fellowship programs to which graduates have been accepted. Please note eight graduates reported that they had received a fellowship but did not list the name of the fellowship program. The Fulbright Fellowship was the most frequently cited fellowship program. Class of 2012, Fellowship participation Program Number reporting Fulbright Fellowship 8 Oak Ridge Institute of Science and Education (FDA) 1 IDEX Fellowship 1 Total 10 CONCLUSION The percent of Boston College graduates who planned to work full time has been gradually increasing over the past three years, from 55.9% in 2010 to 61.0% in 2012. The percent planning to enroll in graduate school peaked at 28.1% in 2010 and has held steady around 23% for the past two years. It will be interesting to monitor the results for future classes to assess whether these trends continue. Post-Graduation Plans Survey Class of 2012 | Page 17 | Office of Institutional Research | February 2013

