Mid-Latitude / Plasmasphere Boundary Layer Radar Millstone Hill ISR John Foster
advertisement

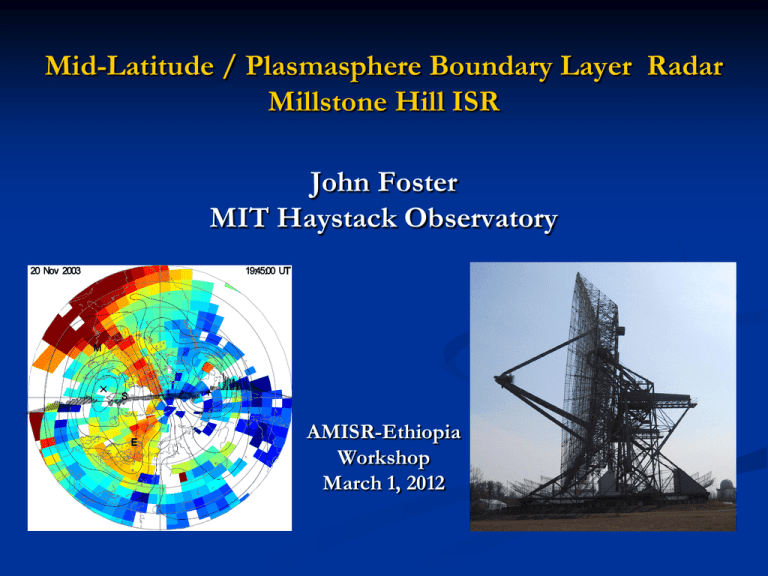
Mid-Latitude / Plasmasphere Boundary Layer Radar Millstone Hill ISR John Foster MIT Haystack Observatory AMISR-Ethiopia Workshop March 1, 2012 MIT Millstone Hill Radar 50 Years of Discovery in the ‘Well-Understood’ Mid-Lat Ionosphere LOCATION – Mid-Latitude/PBL Trough & SAR Arc Studies Space Weather Studies Sub-Auroral Polarization Stream SED: Storm Enhanced Density Plasma redistribution Coherent Backscatter ERB – current-enhanced ion line backscatter Atmosphere – Ionosphere Coupling (SSW) “Build a capable system and explore the unknown” Haystack Observatory Millstone Hill Observatory Millstone Hill Radar Wide Coverage with the MISA Antenna 1979 Zenith Antenna Studies of the Mid-Latitude Trough MHR: Trough-PBL Phenomena SAR (Stable Auroral Red) Arcs SAPS SAR Broad Coverage of MidLatitude Geospace for Event Studies & Modeling Foster, J. C., J. M. Holt, R. E. Musgrove, and D. S. Evans, Ionospheric Convection Associated with Discrete Levels of Particle Precipitation, Geophys. Res. Lett., 13, 656-659, 1986. ISRIM Empirical Ionospheric Models • Statistically constructed from 5+ decades of ISR data • Local and regional models available • Coverage through E and F region (topside in some cases) • Ne, Te, Ti, Velocity • Empirical convection models also available J. M. Holt, S.-R. Zhang (MIT) Publications: 2002 and following Model code, runs available at MIT Haystack website Parameterized: F10.7, Ap, DOY, SLT, Gdlat ISRIM Empirical Ionospheric Models Statistical Characterization of the Madrigal ISR Data Archives Long-term temperature changes in the upper atmosphere A significant long-term cooling trend in the upper atmosphere has been detected using incoherent scatter radar observations made over nearly 40 years above Millstone Hill. This cooling is associated with the so-called global warming in the ground temperature, and has impact on human space activities due to atmospheric density reduction. (left, ion temperature trends in K/year; right, ion temperature trends in %/decade. Midday data.) Location: Plasmasphere / Ring Current M-I Studies Discovery: Sub-Auroral Polarization Stream Empirical 2-Cell Convection plus SAPS Electric Field SAPS Convection Channel Yeh et al.[1991] Ring Current M-I Coupling drives SAPS (Sub Auroral Polarization Stream) Duskside Region-2 FACs close poleward across lowconductance ionosphere AURORAL OVAL SAPS: Strong poleward Electric Fields are set up across the sub-auroral ionosphere SAPS erodes the cold plasma of the ionosphere and the outer plasmasphere LOW S SAPS E FIELD Coherent F-B returns @ range < 1300 km SAPS PBL: SAPS & Ionospheric Trough Radar Scan: Elevated TEC and Steep Gradients [Foster, JGR, 1993] Millstone Hill IS Radar Discovery: Storm Enhanced Density Geodetic Latitude Electron Density at 500 km Altitude noon midnight Universal Time 18-19 March 1990 Foster, JGR, 1993 Snapshots of the Plasmasphere Boundary Layer Storm Enhanced Density (SED) Mid-Latitude Ionosphere Radar Scan Composite picture of SED plume (ISR & DMSP) lying at inner extent of SAPS Channel SED lies where equatorward extent of SAPS overlaps plasmasphere field lines F-Region flux ~ E15 (m-2s-1) Ion Flux is Product of Density times Velocity Log Ion Flux: 14 – 15 m-2 s-1 SAID Ion Flux – Geospace Plasma Redistribution GPS TEC Plasma Redistribution TEC/Plasmasphere Plume March 31, 2001 Magnetosphere-Ionosphere Coupling Ground-Based GPS Maps TEC Plume [Foster et al., GRL 2002] Radar Flux Direct Observation of Velocity and Flux by Millstone Hill ISR Plasmasphere / Ring Current Interactions April 17, 2002 NASA IMAGE SAPS Channel Sun (Merged image courtesy J. Goldstein) Plasmasphere Erosion Plume Sub-Auroral Ion Drifts (SAID): Variability/Instability in the Sub-Auroral Polarization Stream s > 10-11 m-1 [Foster and Tetenbaum (1990, 1992)] Subauroral Electric Field Experiments Using UHF F-B Coherent Scatter [Sensitivity maps convolve beam pattern, magnetic field geometry, aspect sensitivity] Fine scale probe of E region electric field dynamics Scatter sensitivity all along zero aspect line (in antenna sidelobes) Magnetic aspect angle controls scatter sensitivity Geometry allows range to lat/lon conversion Strong scatter appears in main beam and sidelobes Zero aspect scatter goes to radar horizon @ 1300 km Main hotspot Erickson et al, 2002 SAID: Instability in SAPS Channel Radar Bean Spans SAPS Channel Equatorward of Electron Precipitation 40 mV/m E-field Magnitude Variability ~200 – 300 s periodicity Enhanced Radar Backscatter (ERB) from Topside F Region (Destabilization of Ion Acoustic Waves at PBL) [Foster et al., GRL, 1988] Mid-Latitude Topside non-Thermal Backscatter ERB associated with Current Closure across SAPS Channel (Millstone Hill Azimuth Scan) [Foster , 1988] Plumes/Gradients Modify Radiation Belt WPI SAPS Discovery: Polar Tongue of Ionization (TOI) [Foster et al., 1989] Global Phenomenon: Multi-Instrument Observations Provide Geophysical Context and System Viewpoint ISR Fields of View Merged SuperDARN/DMSP Convection Common projection: maglat/MLT @ 350 km alt [Foster et al., JGR 2005] Millstone Hill ISR 10x Enhancement of Topside F-Region Density as SED Traverses the Cusp Feb 06, 1986 Millstone Hill Nov 30, 2003 Millstone Hill SED in the Cusp Creates a Strong Source of Ionospheric Heavy Ions for Magnetosphere-Injection Processes Coupling between the lower and upper atmosphere •Recent studies show a strong connection between the high-latitude stratosphere (20-30 km above ground) and low-latitude ionosphere (100-1000 km above ground) •Ionospheric effects of SSW by Millstone Hill ISR (Goncharenko and Zhang, 2008), Jicamarca ISR (Chau et al., 2009), GPS TEC (Goncharenko et al., 2010) •Selected as Focused Research Topic for NASA 2012 LWS TR&T “These new results have triggered an explosion of studies of mechanisms and types of possible connections between terrestrial and space weather during SSW and other large-scale perturbations in the lower atmosphere” – Wang et al., 2011 Temperature variations during SSW Data: Millstone Hill ISR, 42oN Model: TIMEGCM You are here Goncharenko and Zhang, 2008 Liu and Roble, 2002 •Data: warming at 120-140km; cooling above ~150 km; 12-hour wave; •First experimental evidence of alternating warming and cooling of upper atmosphere •Model: mesospheric cooling and secondary lower thermospheric 33 warming PFISR, RISR & New Mid-Latitude SuperDARN Radars Extend Global-Scale Ionospheric Coverage 2011 Aleutian Islands, AK 2012 Azore Islands, Portugal OSU – 2010 Corvallis, OR FHSU – 2009 Hays, KS Large Field of View of Millstone Hill Complements Multi-Instrument Regional DASI


