- (,) F- ly Yx (,) L,--.7
advertisement
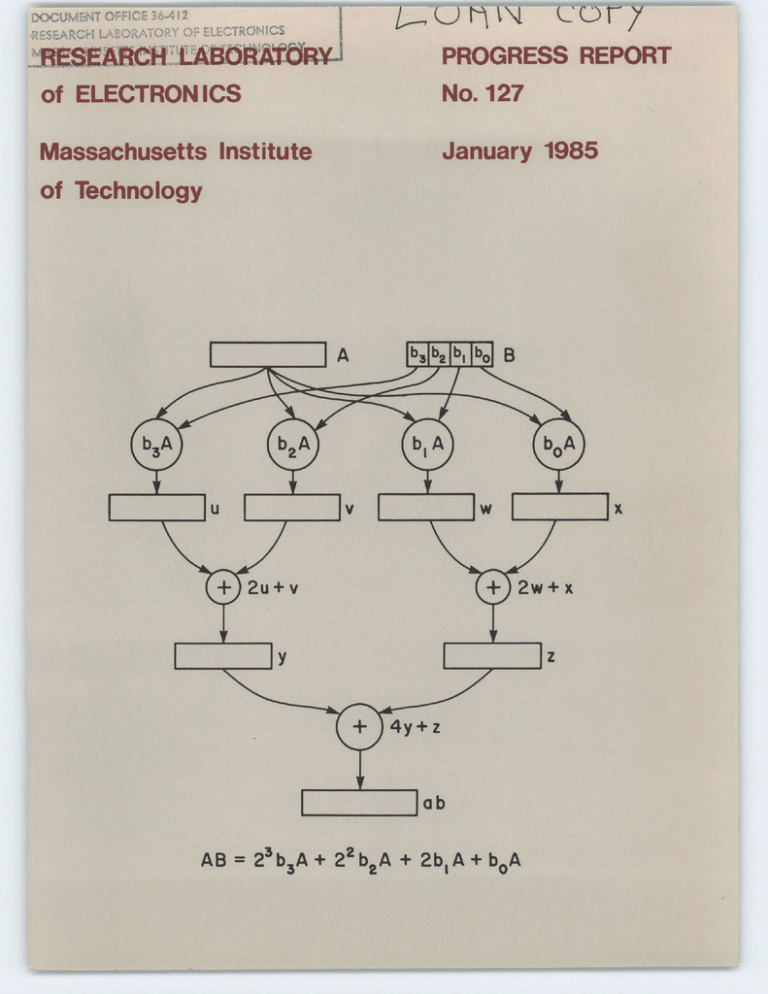
Yx L,--.7 (,) rl t N - (,)F-ly Massachusetts Institute of Technology RESEARCH LABORATORY OF ELECTRONICS RLE PROGRESS REPORT No. 127 January 1985 Submitted by: J. Allen R. Birgeneau This report, No. 127 in a series of Progress Reports issued by the Research Laboratory of Electronics, contains the customary annual statement of research objectives and summary of research for each group. The report covers the period January 1, 1984-December 31, 1984, and the source of support is indicated for each project. On the masthead of each section are listed the academic and research staff and the graduate students who participated in the work of the group during the year. The listing of personnel in the back of the book includes only members of the laboratory during 1984. Cover: Data dependence graph for a parallel multiplier. The length of the multiplier operand is 4 bits. Allen, J., "Computer Architecture for Digital Signal Processing," Proc. IEEE, Vol. 73, No. 5, May 1985, pp. 852-873. RLE P.R. No. 127 List of Figures 26 Approximate representation of the rib guide with sloped sides (a), and the resulting equivalent circuit (b). A three-step approximation is shown, and for purposes of illustration it is assumed that the slab guides are single mode in the last step and in the outer region. 44 Figure 9-1: Interaction energy of Al with GaAs(110). The energy between the lowest dip and highest peak is -1.5 eV. 45 Figure 9-2: Phase diagrams in reduced parameter space for (a) "(2X1)" and (b) "c(2X2)" families. The "X"'s correspond to intersections of a particular set of interaction parameters of the Si(100) system at varying temperatures. In (a) F is 2X1, LAF is p(2X2) and AF is c(4X2). In (b) F is c(2X2) and LAF is p(2X4). In each case, P denotes a disordered phase. Figure 21-1: Comparison of theory and experiment on the ionization yield for 130 4-photon resonant ionization in hydrogen. The pulse energy is 7.1 mJ. Zero on the laser detuning scale is the ionization threshold. Figure 21-2: Cascade (2p -- 2s) Fluorescence as a function of a laser frequency. The 131 two peaks reflect the hyperfine structure of the 32Sl/2 and 22S1/2 states of lithium 7. Figure 21-3: Decrease in cascade fluorescence as a function of laser frequency at 132 the 15p state. The measurement time was 6 seconds and the chopping frequency was 665 Hz. 135 Figure Figure 21-4 136 Figure Scattering signal for jf = 15. Figure Rate constants kvi. ,J =42 - v.+ Av, iversus j for Li *-IIe,Ne, Ar and 138 XeAv = -1 collisions. For 1.i - ic, a dashed line connects the data points. For L,* -Ne, Ar. andXe solid curves demonstrate the identical shape of the distributions for these systems. The solid curves are the average of the latter three systems, scaled for best fit to each system. Figure 22-1: The perpendicular energy moment, normalized to the bulk temperature 144 (TL / 71;) as a function of the normalized momentum (pl /pt,pt = mnv). The spectrum is located between n11 = 1.8 and 4.5. D - 20 and Z. = 1 are assumed. The interval in p between the dotted lines corresponds to the resonant region. Figure 22-2: Surface of section plot for e = 8x 10 3 , k = 0.2, w = 1.0, rm = 0.2, 147 8 m = 0.1. Figure 22-3: Surface of section plot for e = 8 x 10- 3, k = 0. 2 , = 1.0, m = 0.05, 147 So = 0.1. = 0.9, o m = 10- 2 148 Figure 22-4: < I > versus time for e = 8 x 10- 3 , k = 0.2, Swm = 0.1. < I2 > is the ensemble average of 12 over 1200 electrons starting with different initial conditions. 148 Figure 22-5: < 1 > versus time for e = 8 x 10- 3 , k = 0.2, w = 0. 9 , wm = 10- 3 Figure 5-1: 80 m = 0.1. Figure 22-6: Effect of increasing v = v h /v0 , while keeping the ions cold, on the time-asymptotic pulse shape in the Pierce-Buneman regime (a), and in the ion-acoustic regime (b). Figure (c) shows evolution of ion-acoustic pulse shape with increasing vi = v hi/vO for a fixed value of electron temperature (ve = 5.0). Figure 25-1: Figure 25-1 Figure 27-1: a) Photolithographic Probe Tip in Holder: Perspective View 150 188 200 RLE P.R. No. 127 Figure Figure Figure Figure Figure b) Photolithographic -Probe Tip in Holder: Cross-Section View (B-B' axis perpendicular to page) 27-2: Probe Tip on LPE-YIG 27-3: Optical Circuit Schematic - Unfocused Light Experiment 27-4: Optical Circuit Schematic - Focused Light Experiments 27-5: Electrical Characteristics of Low and High Water Content Biological Tissue as Function of Frequency 27-6: Power Contour Patterns for Symmetric Finite Length Cylinder at .915 GHz (, ' = 50, e" = 31). a) R = 4.1cm, L = 10 cm, b) R = 4.6 cm, L = 100 cm. RLE P.R. No. 127 200 201 201 203 204

