Lesson 18. Multivariable Functions 1 Today...
advertisement
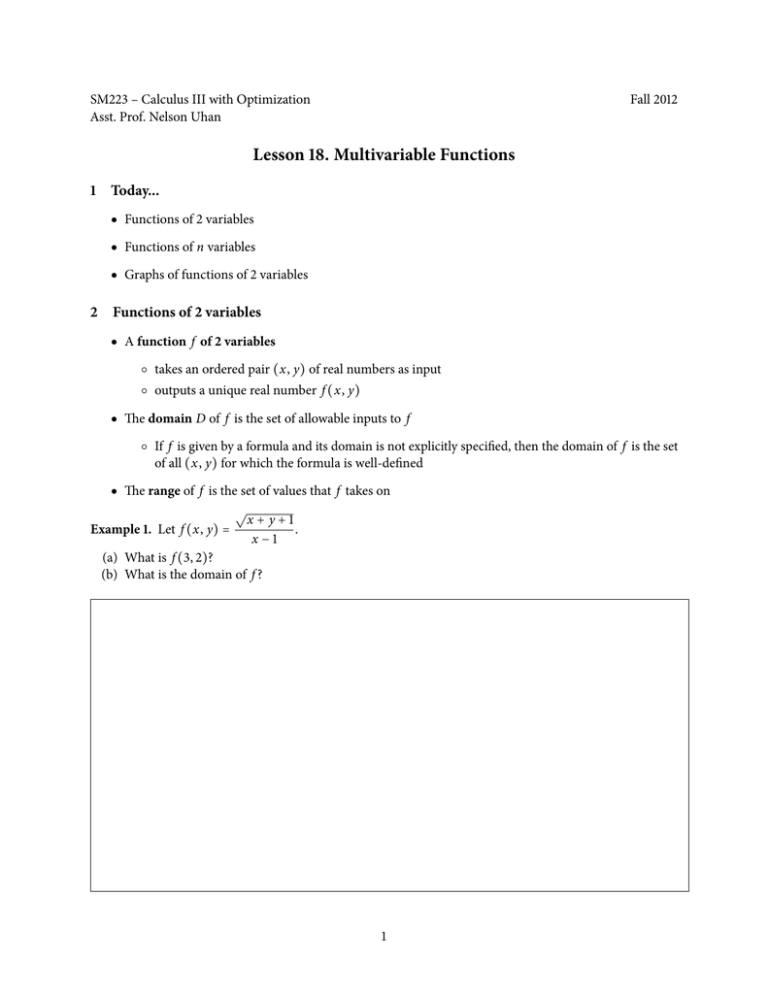
SM223 – Calculus III with Optimization Asst. Prof. Nelson Uhan Fall 2012 Lesson 18. Multivariable Functions 1 Today... ● Functions of 2 variables ● Functions of n variables ● Graphs of functions of 2 variables 2 Functions of 2 variables ● A function f of 2 variables ○ takes an ordered pair (x, y) of real numbers as input ○ outputs a unique real number f (x, y) ● The domain D of f is the set of allowable inputs to f ○ If f is given by a formula and its domain is not explicitly specified, then the domain of f is the set of all (x, y) for which the formula is well-defined ● The range of f is the set of values that f takes on √ x + y+1 Example 1. Let f (x, y) = . x −1 (a) What is f (3, 2)? (b) What is the domain of f ? 1 ● Example: in 1928, using economic data published by the government, Cobb and Douglas modeled production output P(L, K) as a function of the amount of labor involved L and the amount of capital invested K: P(L, K) = 1.01L0.75 K 0.25 ○ This function (in a more general form) is known as the Cobb-Douglas production function ● Note: functions are not always represented by explicit formulas ● Example: the wind-chill index W(T, v) is a subjective temperature that is a function of the actual temperature T (in ○ C) and wind speed v (in km/h), as given by the table below: ○ If the temperature is −15○ C and the wind speed is 40 km/h, then the wind-chill index is Example 2. Give an example of a function of 2 variables that models some real-world phenomenon. Be creative! In particular: (a) Explain what the variables (inputs) represent. (b) Explain what the function value (output) represents. (c) Give a formula for your function (make up something somewhat reasonable). 2 3 Functions of n variables ● A function f of n variables ○ takes an ordered tuple (x1 , . . . , x n ) of real numbers as input ○ outputs a unique real number f (x1 , . . . , x n ) ● Example: ○ Anteater-Bugs produces n types of beers ○ It costs c i to produce one bottle of beer i, i = 1, . . . , n ○ Say that x i bottles of beer i are produced, i = 1, . . . , n ○ Cost of producing x1 bottles of beer 1, x2 bottles of beer 2, etc.: 4 Graphs of functions in 2 variables ● Let f be a function of 2 variables with domain D ● The graph of f is the set of all points (x, y, z) in R3 such that z = f (x, y) and (x, y) is in D Example 3. Sketch the graph of f (x, y) = x 2 + 2y2 . z O y x ● If the function defines a plane or quadric surface, then figuring out the graph is pretty easy ● What about more complicated functions? For example: ○ The Cobb-Douglas function: f (x, y) = 1.01x 0.75 y0.25 ○ f (x, y) = sin x + sin y ○ f (x, y) = x 2 + 3y2 2 2 e −x +y 3


