AIR QUALITY 8.
advertisement

This file was created by scanning the printed publication.
Errors identified by the software have been corrected;
however, some errors may remain.
8. AIR QUALITY
R. C. Musselman
Rocky Mountain Forest and Range Experiment Station
Fort Collins, Colorado
Air quality is monitored continuously at GLEES. Air
pollutants are considered an important component of
the atmosphere that can have an effect on terrestrial and
aquatic ecosystems. Atmospheric deposition of gases,
wet deposition of chemicals in precipitation including
snow and rain, and dry deposition of chemicals are all
monitored at GLEES. Although GLEES is a relatively
remote and unpolluted site, deposition of pollutants can
be important. The effects of ozone on native vegetation
in alpine and subalpine ecosystems is generally unknown, but relatively high concentrations of ozone have
been recorded at GLEES. Wet and dry deposition is important in snowmelt chemistry and subsequent input
to aquatic ecosystems at GLEES.
Wet deposition is monitored at the GLEES Snowy
Range National Atmospheric Deposition Program
(NADP) site on the west shore of West Glacier Lake.
The station has been in operation since 1986, and was
initially installed and operated by the University of
Wyoming. It has been operated by the Rocky Mountain
Station since 1990. Wet precipitation is collected every
Tuesday at the site and sent to the NADP Central Analytical Laboratory (CAL) in Illinois. Protocols allow collection on Wednesdays if necessary. The Snowy Range
site is one of about 200 wet deposition sites in the network. Precipitation is also recorded at the NADP site
with a standard Alter-shielded Belfort rain gage. Precipitation collection in winter is low since snow tends
to blow out of the buckets used for water chemistry
samples. Research on better snow collection methods
is being conducted. Weekly data from the Snowy Range
NADP site and from the entire network is available from
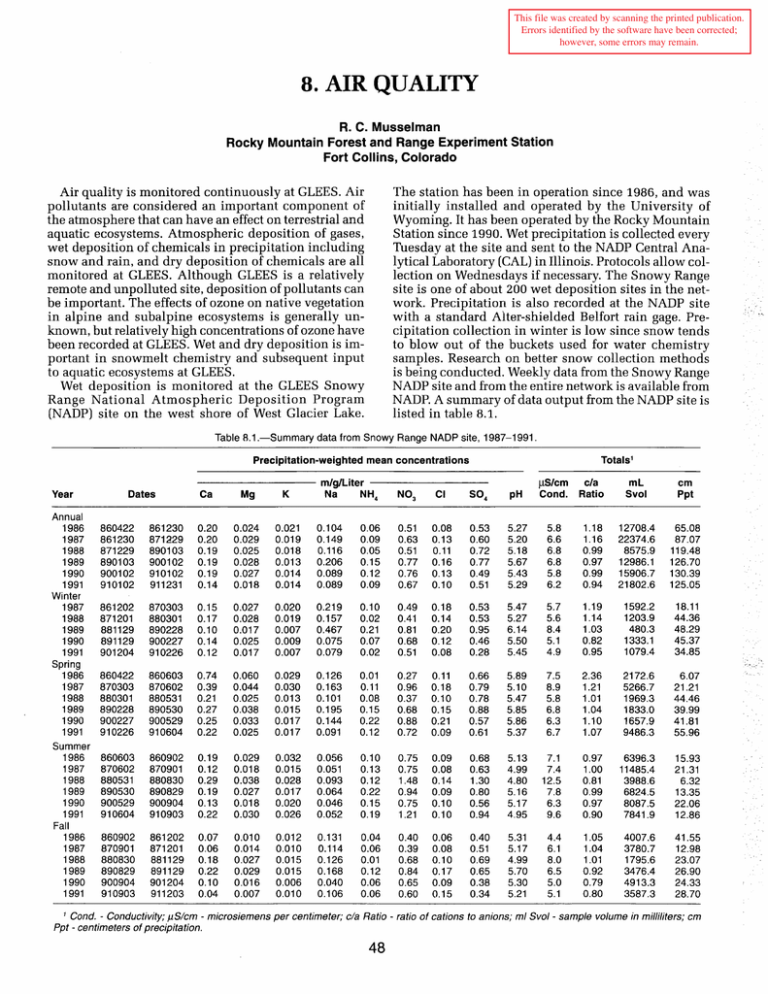
NADP. A summary of data output from the NADP site is
listed in table 8.1.
Table 8.1.-Summary data from Snowy Range NADP site, 1987-1991.
Totals 1
Precipitation-weighted mean concentrations
Year
Annual
1986
1987
1988
1989
1990
1991
Winter
1987
1988
1989
1990
1991
Spring
1986
1987
1988
1989
1990
1991
Summer
1986
1987
1988
1989
1990
1991
Fall
1986
1987
1988
1989
1990
1991
Dates
861230
m/g/Liter
Na
NH 4
Ca
Mg
K
0.024
0.029
0.025
0.028
0.027
0.018
0.021
0.019
0.018
0.013
0.014
0.014
0.104
0.149
0.116
0.206
0.089
0.089
~/em
N0 3
Cl
S0 4
pH
Cond.
c/a
Ratio
ml
Svol
em
Ppt
0.06
0.09
0.05
0.15
0.12
0.09
0.51
0.63
0.51
0.77
0.76
0.67
0.08
0.13
0.11
0.16
0.13
0.10
0.53
0.60
0.72
0.77
0.49
0.51
5.27
5.20
5.18
5.67
5.43
5.29
5.8
6.6
6.8
6.8
5.8
6.2
1.18
1.16
0.99
0.97
0.99
0.94
12708.4
22374.6
8575.9
12986.1
15906.7
21802.6
65.08
87.07
119.48
126.70
130.39
125.05
860422
861230
871229
890103
900102
910102
890103
900102
910102
911231
0.20
0.20
0.19
0.19
0.19
0.14
861202
871201
881129
891129
901204
870303
880301
890228
900227
910226
0.15
0.17
0.10
0.14
0.12
0.027
0.028
0.017
0.025
0.017
0.020
0.019
0.007
0.009
0.007
0.219
0.157
0.467
0.075
0.079
0.10
0.02
0.21
0.07
0.02
0.49
0.41
0.81
0.68
0.51
0.18
0.14
0.20
0.12
0.08
0.53
0.53
0.95
0.46
0.28
5.47
5.27
6.14
5.50
5.45
5.7
5.6
8.4
5.1
4.9
1.19
1.14
1.03
0.82
0.95
1592.2
1203.9
480.3
1333.1
1079.4
18.11
44.36
48.29
45.37
34.85
860422
870303
880301
890228
900227
910226
860603
870602
880531
890530
900529
910604
0.74
0.39
0.21
0.27
0.25
0.22
0.060
0.044
0.025
0.038
0.033
0.025
0.029
0.030
0.013
0.015
0.017
0.017
0.126
0.163
0.101
0.195
0.144
0.091
0.01
0.11
0.08
0.15
0.22
0.12
0.27
0.96
0.37
0.68
0.88
0.72
0.11
0.18
0.10
0.15
0.21
0.09
0.66
0.79
0.78
0.88
0.57
0.61
5.89
5.10
5.47
5.85
5.86
5.37
7.5
8.9
5.8
6.8
6.3
6.7
2.36
1.21
1.01
1.04
1.10
1.07
2172.6
5266.7
1969.3
1833.0
1657.9
9486.3
6.07
21.21
44.46
39.99
41.81
55.96
860603
870602
880531
890530
900529
910604
860902
870901
880830
890829
900904
910903
0.19
0.12
0.29
0.19
0.13
0.22
0.029
0.018
0.038
0.027
0.018
0.030
0.032
0.015
0.028
0.017
0.020
0.026
0.056
0.051
0.093
0.064
0.046
0.052
0.10
0.13
0.12
0.22
0.15
0.19
0.75
0.75
1.48
0.94
0.75
1.21
0.09
0.08
0.14
0.09
0.10
0.10
0.68
0.63
1.30
0.80
0.56
0.94
5.13
4.99
4.80
5.16
5.17
4.95
7.1
7.4
12.5
7.8
6.3
9.6
0.97
1.00
0.81
0.99
0.97
0.90
6396.3
11485.4
3988.6
6824.5
8087.5
7841.9
15.93
21.31
6.32
13.35
22.06
12.86
860902
870901
880830
890829
900904
910903
861202
871201
881129
891129
901204
911203
0.07
0.06
0.18
0.22
0.10
0.04
0.010
0.014
0.027
0.029
0.016
0.007
0.012
0.010
0.015
0.015
0.006
0.010
0.131
0.114
0.126
0.168
0.040
0.106
0.04
0.06
0.01
0.12
0.06
0.06
0.40
0.39
0.68
0.84
0.65
0.60
0.06
0.08
0.10
0.17
0.09
0.15
0.40
0.51
0.69
0.65
0.38
0.34
5.31
5.17
4.99
5.70
5.30
5.21
4.4
6.1
8.0
6.5
5.0
5.1
1.05
1.04
1.01
0.92
0.79
0.80
4007.6
3780.7
1795.6
3476.4
4913.3
3587.3
41.55
12.98
23.07
26.90
24.33
28.70
871~29
1
Cond. - Conductivity; J1Sicm - microsiemens per centimeter; cia Ratio - ratio of cations to anions; ml Svol - sample volume in milliliters; em
Ppt - centimeters of precipitation.
48
Dry deposition is monitored at the Brooklyn Lake
monitoring site with two samplers using filter pack technology, the Stacked Filter Unit (SFU) Network from
University of California at Davis and the National Dry
Deposition Network (NDDN) operated for the U.S. Environmental Protection Agency. The SFU filter pack is
sent to the University of California at Davis for analysis. The analysis measures concentrations of elements
from sodium to lead by particle-induced x-ray emission
(PIXE), using the Crocker Nuclear Laboratory cyclotron.
Also measured by the network are optical absorption
(by laser integrating plate method, LIRM), fine mass and
coarse mass particles (by gravimetric measurement), and
hydrogen (by proton elastic scattering analysis, PESA).
A sample of data output is listed in table 8.2.
The National Dry Deposition Network (NDDN) is a
network of dry deposition monitoring sites in the United
States operated for the U.S. EPA. An NDDN site located
at GLEES is designated as the Centennial site, CNT169.
The Centennial NDDN site is one of only 12 NDDN sites
in the western United States. NDDN protocols collect
dry deposition on a three-stage filter pack. Teflon, nylon, and paper filters each absorb different chemical
species. All samples are analyzed in a central analytical lab located in Florida. NDDN filters are changed
every Tuesday and sent to the lab for processing. NDDN
sites also monitor meteorological conditions and ozone
continuously. Data available from the NDDN site includes meteorological measurements of wind speed,
wind direction, relative humidity, solar radiation, precipitation, and ambient temperature. Filter pack flow
rate is also recorded at the site. Filter pack chemical
analyses include sulfate, nitrate, ammonium, sodium,
potassium, and nitric acid. Typical-ozone data from the
site for winter and summer is shown in figure 8.1.
A carbon dioxide monitor has been installed at the
Brooklyn site for monitoring of ambient carbon dioxide. Measurements of carbon dioxide in the snowpack
and soil at the Brooklyn site are also made at infrequent
intervals.
100
90
Table 8.2.-Arithmetic mean values, December 1, 1990-February 28,
1991, Stacked Filter Unit (SFU) Particulate Network,
Brooklyn Lakes SFU Site.
Particulate
measurement
H
s
AI
Si
K
Ca
Ti
Mn
Fe
KNON
Na
Cl
v
Ni
Cu
Zn
As
Se
Br
Pb
Fine mass particles (<2.5 um)
Coarse mass particles {>2.5 and <15 um)
Reconstructed mass particles
SOIL (Sum of AI, Si, Ca, Ti, and Fe)
Ammonium sulfate (calculated)
Organic mass from hydrogen
Optical absorption
80
70
60-
24-hour concentration
nanograms/cubic meter
.0
0..
0..
50
40-
57.6
132.00
15.30
48.00
11.60
16.10
1.84
0.39
13.50
3.49
6.47
3.07
0.84
0.44
0.79
0.87
0.13
0.17
0.62
0.68
1.95
2.49
1.21
0.22
0.54
0.34
1.86
----t-------+--=+=-' :--r-
30-
20 - -
I ----
10-
0
180
185
July 1 =Day 182
190
195
200
205
210
215
July 31 = Day 212
Julian Day
100-,--------,--------------~---
90 - - - - - - - - - - - - - - - - - - - - - - - - - ; - - - - - - - - - - - - - - - - - - - - - -
80i-----T-----------+------'------'--------I
v
7 0 - I - - - - - _ _ _ J - - - - + - - - - - + - - - + - '_ _ _!_______ _
6o
it :
~.- - :-.- - - -. ,{+-·J-11
I
I
~-1\ ,\. .,-.[- l~-___,_V\-,
rl\-,-rf\1\v-+--.
i
~-----
=r~
I
•
20---~---~~---~--~~------~-----
10--j-----l------,-----+--~!-----t-----l
0+----+---+----+---+----,--~
335
340
Dec. 1 = Day 335
345
350
Julian Day
355
360
365
Dec. 31 = Day 365
Figure 8.1.-0zone concentrations in summer and winter from
Centennial NDDN site, Brooklyn Lake, GLEES.
49


