NHDPlus Stream Segment (Reach) Attributes Attribute Description
advertisement
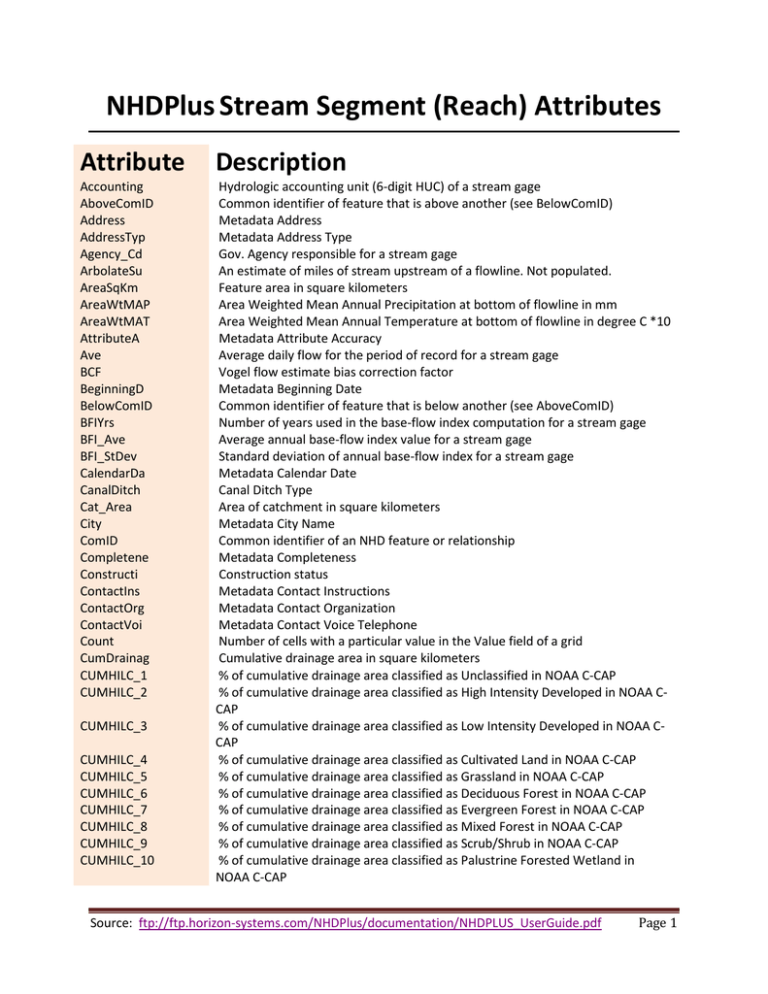
NHDPlus Stream Segment (Reach) Attributes Attribute Description Accounting AboveComID Address AddressTyp Agency_Cd ArbolateSu AreaSqKm AreaWtMAP AreaWtMAT AttributeA Ave BCF BeginningD BelowComID BFIYrs BFI_Ave BFI_StDev CalendarDa CanalDitch Cat_Area City ComID Completene Constructi ContactIns ContactOrg ContactVoi Count CumDrainag CUMHILC_1 CUMHILC_2 Hydrologic accounting unit (6-digit HUC) of a stream gage Common identifier of feature that is above another (see BelowComID) Metadata Address Metadata Address Type Gov. Agency responsible for a stream gage An estimate of miles of stream upstream of a flowline. Not populated. Feature area in square kilometers Area Weighted Mean Annual Precipitation at bottom of flowline in mm Area Weighted Mean Annual Temperature at bottom of flowline in degree C *10 Metadata Attribute Accuracy Average daily flow for the period of record for a stream gage Vogel flow estimate bias correction factor Metadata Beginning Date Common identifier of feature that is below another (see AboveComID) Number of years used in the base-flow index computation for a stream gage Average annual base-flow index value for a stream gage Standard deviation of annual base-flow index for a stream gage Metadata Calendar Date Canal Ditch Type Area of catchment in square kilometers Metadata City Name Common identifier of an NHD feature or relationship Metadata Completeness Construction status Metadata Contact Instructions Metadata Contact Organization Metadata Contact Voice Telephone Number of cells with a particular value in the Value field of a grid Cumulative drainage area in square kilometers % of cumulative drainage area classified as Unclassified in NOAA C-CAP % of cumulative drainage area classified as High Intensity Developed in NOAA CCAP % of cumulative drainage area classified as Low Intensity Developed in NOAA CCAP % of cumulative drainage area classified as Cultivated Land in NOAA C-CAP % of cumulative drainage area classified as Grassland in NOAA C-CAP % of cumulative drainage area classified as Deciduous Forest in NOAA C-CAP % of cumulative drainage area classified as Evergreen Forest in NOAA C-CAP % of cumulative drainage area classified as Mixed Forest in NOAA C-CAP % of cumulative drainage area classified as Scrub/Shrub in NOAA C-CAP % of cumulative drainage area classified as Palustrine Forested Wetland in NOAA C-CAP CUMHILC_3 CUMHILC_4 CUMHILC_5 CUMHILC_6 CUMHILC_7 CUMHILC_8 CUMHILC_9 CUMHILC_10 Source: ftp://ftp.horizon-systems.com/NHDPlus/documentation/NHDPLUS_UserGuide.pdf Page 1 NHDPlus Stream Segment (Reach) Attributes Attribute Description CUMHILC_11 % of cumulative drainage area classified as Palustrine Scrub/Shrub Wetland in NOAA C-CAP % of cumulative drainage area classified as Palustrine Emergent Wetland in NOAA C-CAP % of cumulative drainage area classified as Estuarine Forested Wetland in NOAA C-CAP % of cumulative drainage area classified as Estuarine Scrub/Shrub Wetland in NOAA C-CAP % of cumulative drainage area classified as Estuarine Emergent Wetland in NOAA C-CAP % of cumulative drainage area classified as Unconsolidated Shore in NOAA CCAP % of cumulative drainage area classified as Bare Land in NOAA C-CAP % of cumulative drainage area classified as Water in NOAA C-CAP % of cumulative drainage area classified as Palustrine Aquatic Bed in NOAA CCAP % of cumulative drainage area classified as Estuarine Aquatic Bed in NOAA CCAP % of cumulative drainage area classified as Tundra in NOAA C-CAP % of cumulative drainage area classified as Snow/Ice in NOAA C-CAP % of cumulative drainage area classified as Open Water in NLCD % of cumulative drainage area classified as Perennial Ice/Snow in NLCD % of cumulative drainage area classified as Low Intensity Residential in NLCD % of cumulative drainage area classified as High Intensity Residential in NLCD Commercial/Industrial/Transportation in NLCD % of cumulative drainage area classified as Bare Rock/Sand/Clay in NLCD % of cumulative drainage area classified as Quarries/Strip Mines/Gravel Pits in NLCD % of cumulative drainage area classified as Transitional in NLCD % of cumulative drainage area classified as Deciduous Forest in NLCD % of cumulative drainage area classified as Evergreen Forest in NLCD % of cumulative drainage area classified as Mixed Forest in NLCD % of cumulative drainage area classified as Shrubland in NLCD % of cumulative drainage area classified as Orchards/Vineyards/Other in NLCD % of cumulative drainage area classified as Grasslands/Herbaceous in NLCD % of cumulative drainage area classified as Pasture/Hay in NLCD % of cumulative drainage area classified as Row Crops in NLCD % of cumulative drainage area classified as Small Grains in NLCD % of cumulative drainage area classified as Fallow in NLCD % of cumulative drainage area classified as Urban/Recreational Grasses in NLCD % of cumulative drainage area classified as Woody Wetlands in NLCD % of cumulative drainage area classified as Emergent Herbaceous Wetlands in NLCD % of cumulative drainage area in Canada and not classified in NLCD CUMHILC_12 CUMHILC_13 CUMHILC_14 CUMHILC_15 CUMHILC_16 CUMHILC_17 CUMHILC_18 CUMHILC_19 CUMHILC_20 CUMHILC_21 CUMHILC_22 CumNLCD_11 CumNLCD_12 CumNLCD_21 CumNLCD_22 CumNLCD_23 CumNLCD_31 CumNLCD_32 CumNLCD_33 CumNLCD_41 CumNLCD_42 CumNLCD_43 CumNLCD_51 CumNLCD_61 CumNLCD_71 CumNLCD_81 CumNLCD_82 CumNLCD_83 CumNLCD_84 CumNLCD_85 CumNLCD_91 CumNLCD_92 Cumpct_CN Source: ftp://ftp.horizon-systems.com/NHDPlus/documentation/NHDPLUS_UserGuide.pdf Page 2 NHDPlus Stream Segment (Reach) Attributes Attribute Description Cumpct_MX Cumsum_pct DA_Sq_Mile % of cumulative drainage area in Mexico and not classified in NLCD Sum of the % cumulative drainage areas Reported drainage area in square miles of a stream gage. Stations with drainage area of -999999 means there is no reported drainage area in National Water Information System Metadata Dataset Credit First date of flow data (yyyymmdd) for a stream gage Last date of flow data (yyyymmdd) for a stream gage Numerical difference between stream level for FromComID and stream level for ToComID in the NHDFlow table Text description of feature type and the encoded attributes 714 for coastal connection, 709 for flowing connection, 712 for network starts, 713 for network ends 0 if flowline is not part of a divergence, 1 if flowline is the main path of a divergence, 2 if flowline is a minor path of a divergence Number of flowlines immediately downstream Stream level of mainstem downstream flowline Downstream mainstem level path identifier Downstream minor path hydrologic sequence number Metadata identifier Feature elevation in feet Always “True” Metadata Ending Date Date an event was created Type of entity in an event Numeric code that contains the feature type and its attributes as found in the NHDFCode lookup table Feature Currency Date Reserved for future use Reserved for future use URL where detailed event entity data can be found Flow direction is “WithDigitized” or “Uninitialized” The common identifier for a flowline in a flow relationship from which water flows (see ToComID) A unique number assigned to the implied node at the upstream end of an NHD Flowline NHD feature type Geographic Names Information System ID for the value in GNIS_Name Feature Name as found in the Geographic Names Information System Flag indicating BFI data (1) or no BFI data (2) for a stream gage Flag indicating flow data (1) or no flow data (0) for a stream gage Value stored in grid cells; a unique identification number for each catchment(compressed numbering system) DataSetCre Day1 DayN DeltaLevel Descriptio Direction Divergence DnDrainCou DnLevel DnLevelPat DnMinHydro DUUID Elevation Enabled EndingDate EventDate EventType FCode FDate FeatureCom FeatureCla FeatureDet Flowdir FromComID FromNode FType GNIS_ID GNIS_Name GOTBFI GOTQ Grid_code Source: ftp://ftp.horizon-systems.com/NHDPlus/documentation/NHDPLUS_UserGuide.pdf Page 3 NHDPlus Stream Segment (Reach) Attributes Attribute Description Grid_count Number of cells with a particular value in the value field; equals the number of 30x30 meter grid cells in each catchment; catchment area can be computed from this field % of catchment area classified as Unclassified in NOAA C-CAP % of catchment area classified as High Intensity Developed in NOAA C-CAP % of catchment area classified as Low Intensity Developed in NOAA C-CAP % of catchment area classified as Cultivated Land in NOAA C-CAP % of catchment area classified as Grassland in NOAA C-CAP % of catchment area classified as Deciduous Forest in NOAA C-CAP % of catchment area classified as Evergreen Forest in NOAA C-CAP % of catchment area classified as Mixed Forest in NOAA C-CAP % of catchment area classified as Scrub/Shrub in NOAA C-CAP % of catchment area classified as Palustrine Forested Wetland in NOAA C-CAP % of catchment area classified as Palustrine Scrub/Shrub Wetland in NOAA CCAP % of catchment area classified as Palustrine Emergent Wetland in NOAA C-CAP % of catchment area classified as Estuarine Forested Wetland in NOAA C-CAP % of catchment area classified as Estuarine Scrub/Shrub Wetland in NOAA CCAP % of catchment area classified as Estuarine Emergent Wetland in NOAA C-CAP % of catchment area classified as Unconsolidated Shore in NOAA C-CAP % of catchment area classified as Bare Land in NOAA C-CAP % of catchment area classified as Water in NOAA C-CAP % of catchment area classified as Palustrine Aquatic Bed in NOAA C-CAP % of catchment area classified as Estuarine Aquatic Bed in NOAA C-CAP % of catchment area classified as Tundra in NOAA C-CAP % of catchment area classified as Snow/Ice in NOAA C-CAP Metadata Horizontal Positional Accuracy Text name of Subbasin Hydrologic Cataloging Unit (8-digit HUC) of the gage 8-digit Hydrologic Unit Code, also known as Subbasin code (formerly known as catalog unit code) Hydrologic Region (2-digit HUC) of the gage Catchment area in square kilometers that drains to the headwater node of the flowline indicated by ComID hydrographic category, Intermittent or perennial Hydrologic sequence number Incremental Flow (cfs) for Flowline as computed by the Unit Runoff Method Inundation Area Type Latitude of the NHD location in decimal degrees, NAD83 Latitude of the streamgage (site) location - gage house in decimal degrees, NAD83 Feature Length in kilometers HILC_1 HILC_2 HILC_3 HILC_4 HILC_5 HILC_6 HILC_7 HILC_8 HILC_9 HILC_10 HILC_11 HILC_12 HILC_13 HILC_14 HILC_15 HILC_16 HILC_17 HILC_18 HILC_19 HILC_20 HILC_21 HILC_22 HorizPosit HU_8_Name HUC HUC_8 HUC_REG HwNodesqkm Hydrograph Hydroseq IncrFlowU Inundation Lat_NHD Lat_Site LengthKM Source: ftp://ftp.horizon-systems.com/NHDPlus/documentation/NHDPLUS_UserGuide.pdf Page 4 NHDPlus Stream Segment (Reach) Attributes Attribute Description LevelPathi LogicalCon Lon_NHD Lon_Site Hydrologic sequence number of most downstream flowline in level path Metadata Logical Consistency Longitude of the NHD location in decimal degrees, NAD83 Longitude of the streamgage (site) location - gage house in decimal degrees, NAD83 Mean Annual Flow (cfs) at bottom of flowline as computed by Unit Runoff Method Mean Annual Flow (cfs) at bottom of flowline as computed by Vogel Method Mean Annual Velocity (fps) at bottom of flowline as computed by Unit Runoff Method Mean Annual Velocity (fps) at bottom of flowline as computed by Vogel Method Maximum elevation (unsmoothed) in meters Maximum elevation (smoothed) in meters Measure along reach where a point event is located, in percent from downstream end Metadata Standard Version Maximum daily flow for the period of record for a stream gage Metadata Date Metadata Standard Name Minimum daily flow for the period of record for a stream gage Minimum elevation (unsmoothed) in meters Minimum elevation (smoothed) in meters Substr(NewReachCo,1,8) New Reach Code in a Reach cross reference entry New Reach date in a Reach cross reference entry not used Number of days of flow data for a stream gage Number of days of non-zero flow for a stream gage Distance between a Stream Gage and the NHD Reach to which it is linked % of catchment area classified as Open Water in National Land Cover Dataset 1992 (NLCD) % of catchment area classified as Perennial Ice/Snow in NLCD % of catchment area classified as Low Intensity Residential in NLCD % of catchment area classified as High Intensity Residential in NLCD % of catchment area classified as Commercial/Industrial/Transportation in NLCD % of catchment area classified as Bare Rock/Sand/Clay in NLCD % of catchment area classified as Quarries/Strip Mines/Gravel Pits in NLCD % of catchment area classified as Transitional in NLCD % of catchment area classified as Deciduous Forest in NLCD % of catchment area classified as Evergreen Forest in NLCD % of catchment area classified as Mixed Forest in NLCD % of catchment area classified as Shrubland in NLCD % of catchment area classified as Orchards/Vineyards/Other in NLCD MAFlowU MAFlowV MAVelU MAVelV MaxElevRaw MaxElevSmo Measure Metadata_1 Max_ MetadataDa MetadataSt Min_ MinElevRaw MinElevSmo NewHUCode NewReachCo NewReachDa NewUPMI NDays NDaysGT0 NHD2Gage_D NLCD_11 NLCD_12 NLCD_21 NLCD_22 NLCD_23 NLCD_31 NLCD_32 NLCD_33 NLCD_41 NLCD_42 NLCD_43 NLCD_51 NLCD_61 Source: ftp://ftp.horizon-systems.com/NHDPlus/documentation/NHDPLUS_UserGuide.pdf Page 5 NHDPlus Stream Segment (Reach) Attributes Attribute Description NLCD_71 NLCD_81 NLCD_82 NLCD_83 NLCD_84 NLCD_85 NLCD_91 NLCD_92 Offset OID OldHUCode OldReachCo OldReachDa OldUpMI Operationa Originator P1 % of catchment area classified as Grasslands/Herbaceous in NLCD % of catchment area classified as Pasture/Hay in NLCD % of catchment area classified as Row Crops in NLCD % of catchment area classified as Small Grains in NLCD % of catchment area classified as Fallow in NLCD % of catchment area classified as Urban/Recreational Grasses in NLCD % of catchment area classified as Woody Wetlands in NLCD % of catchment area classified as Emergent Herbaceous Wetlands in NLCD Display offset for an event Internal ESRI Table row ID Substr(OldReachCo,1,8) Old Reach Code in a reach cross reference entry Old Reach Date in a Reach cross reference entry Not used Operational status Metadata Originator 1st percentile of daily flow for the period of record of a stream gage. Negative values indicate reverse flow; tidal or backwater 5th percentile of daily flow for the period of record of a stream gage. Negative values indicate reverse flow; tidal or backwater 10th percentile of daily flow for the period of record of a stream gage. Negative values indicate reverse flow; tidal or backwater 20th percentile of daily flow for the period of record of a stream gage. Negative values indicate reverse flow; tidal or backwater 25th percentile of daily flow for the period of record of a stream gage. Negative values indicate reverse flow; tidal or backwater 30th percentile of daily flow for the period of record of a stream gage. Negative values indicate reverse flow; tidal or backwater 40th percentile of daily flow for the period of record of a stream gage. Negative values indicate reverse flow; tidal or backwater 50th percentile of daily flow for the period of record of a stream gage. Negative values indicate reverse flow; tidal or backwater 60th percentile of daily flow for the period of record of a stream gage. Negative values indicate reverse flow; tidal or backwater 70th percentile of daily flow for the period of record of a stream gage. Negative values indicate reverse flow; tidal or backwater 75th percentile of daily flow for the period of record of a stream gage. Negative values indicate reverse flow; tidal or backwater 80th percentile of daily flow for the period of record of a stream gage. Negative values indicate reverse flow; tidal or backwater 90th percentile of daily flow for the period of record of a stream gage. Negative values indicate reverse flow; tidal or backwater P5 P10 P20 P25 P30 P40 P50 P60 P70 P75 P80 P90 Source: ftp://ftp.horizon-systems.com/NHDPlus/documentation/NHDPLUS_UserGuide.pdf Page 6 NHDPlus Stream Segment (Reach) Attributes Attribute Description P95 95th percentile of daily flow for the period of record of a stream gage. Negative values indicate reverse flow; tidal or backwater 99th percentile of daily flow for the period of record of a stream gage. Negative values indicate reverse flow; tidal or backwater Distance to terminal flowline % of catchment area in Canada and not classified in NLCD % of catchment area in Mexico and not classified in NLCD Pipeline type Metadata Positional accuracy Metadata Postal Code Mean annual precipitation in mm In a Reach cross reference entry, the name of the process that created the Reach Code change Metadata Process Description Production unit identifier Metadata Process Date Metadata Publication Date Reach Code assigned to feature or reach on which an event is located Reach file version in a Reach cross reference entry Reach Version Date Reach Resolution Relationship to surface Reservoir type Always “Medium” Flag to indicate review status - Y or N of an event location. ESRI feature area in square decimal degrees ESRI feature length in decimal degrees Active (A) or Inactive (I) where active StreamGageEvents have streamflow data in water year(s) 2003 and/or 2004 Slope of flowline (cm/cm) Source of boundary;, 0 = Watershed Boundary Dataset, 1 = NHD, 2 = Other Metadata Source Citation Abbreviation Metadata Source Contribution Metadata Source Currentness Reference Metadata Source Scale Denominator Originator of an event Description of event entity Unique Identifier of event entity, link to external data about entity Special use category Elevation stage 0 if a flowline is not a headwater flowline, 1 if a flowline is a headwater flowline 2 char. state postal abbreviation of the USGS Water Science Center maintaining the gage. Puerto Rico is listed as a state. P99 PathLength Pct_CN Pct_MX PipelineTy Positional PostalCode Precip Process ProcessDes Prod_unit ProssDat Publicatio ReachCode ReachFileV ReachsmDat ReachResol Relationsh ReservoirT Resolution Reviewed Shape_Area Shape_Leng SiteStatus Slope Source SourceCita SourceCont SourceCurr SourceScal Source_Ori Source_Dat Source_Fea SpecialUse Stage StartFlag State Source: ftp://ftp.horizon-systems.com/NHDPlus/documentation/NHDPLUS_UserGuide.pdf Page 7 NHDPlus Stream Segment (Reach) Attributes Attribute Description State_Cd 2-digit state FIPS code of the WSC maintaining the gage. Puerto Rico is listed as a state Station name Metadata State or Province Standard deviation of daily flow for the period of record Stream level (dimensionless) Strahler stream order. Not populated. See NHDPlus data extension table SOSC.dbf. Hydrologic sub-region (4-digit HUC) Sum of the % catchment areas Mean annual temperature in degrees centigrade * 10 0 if a flowline is not a network terminus, 1 if a flowline is a network terminus Hydrologic sequence number of terminal flowline Ordinal value used to display various network densities Metadata title of source data used as input for creating or updating NHD Common identifier for a flowline which is receiving flow in a flow relationship (see FromComID) Not valued A unique number assigned to the implied node at the downstream end of a flowline Metadata type of Source Media Upstream mainstem hydrologic sequence number Upstream mainstem level path identifier Upstream minimum hydrologic sequence number The value stored in grid cells; also known as Grid_code in related tables Metadata Vertical Positional Accuracy ComID of an NHD polygonal water feature through which an NHD “Artificial Path” flowline flows Station_NM StateorPro StDev StreamLeve StreamOrde SubRegion Sum_pct Temp TerminalFl TerminalPa ThinnerCod Title ToComID ToComIDMea ToNode TypeofSour UpHydroSeq UpLevelPat UpMinHydro Value VertPositi WBAreaComI Source: ftp://ftp.horizon-systems.com/NHDPlus/documentation/NHDPLUS_UserGuide.pdf Page 8
