'. Dr. Margaret Bullowa Dr. Paula Menyuk
advertisement
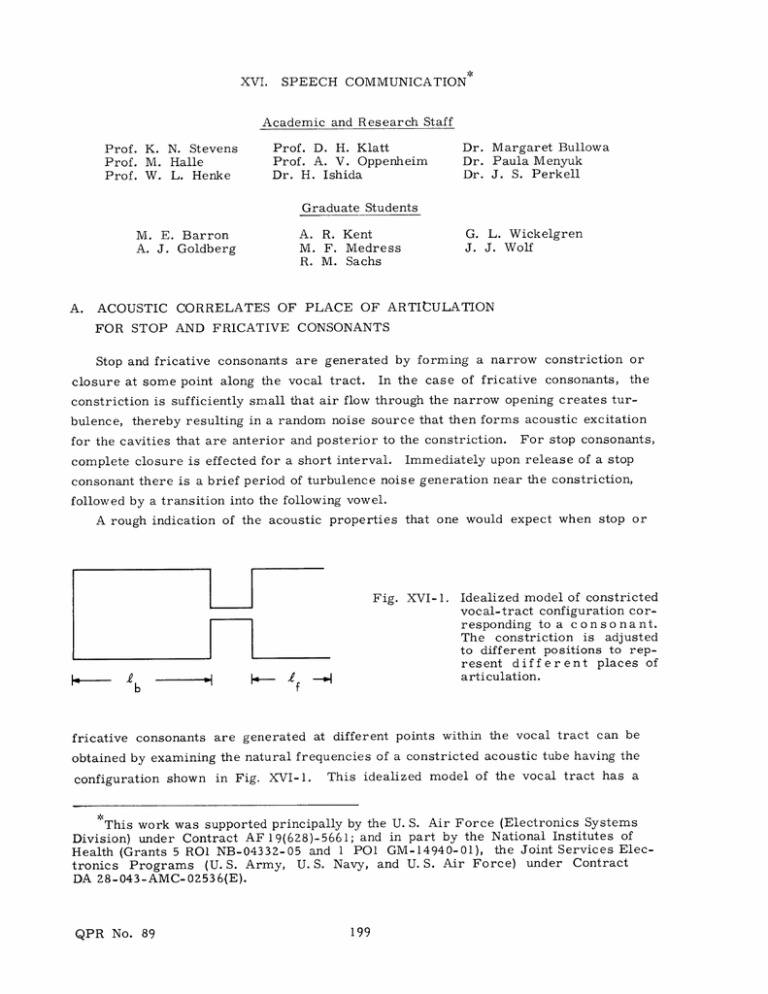
XVI. SPEECH COMMUNICATION Academic and Research Staff Prof. K. N. Stevens Prof. M. Halle Prof. W. L. Henke Prof. D. H. Klatt Prof. A. V. Oppenheim Dr. H. Ishida Dr. Margaret Bullowa Dr. Paula Menyuk Dr. J. S. Perkell Graduate Students A. R. Kent M. F. Medress R. M. Sachs M. E. Barron A. J. Goldberg G. L. Wickelgren J. J. Wolf ACOUSTIC CORRELATES OF PLACE OF ARTICULATION A. FOR STOP AND FRICATIVE CONSONANTS Stop and fricative consonants are generated by forming a narrow constriction or closure at some point along the vocal tract. In the case of fricative consonants, the constriction is sufficiently small that air flow through the narrow opening creates turbulence, thereby resulting in a random noise source that then forms acoustic excitation for the cavities that are anterior and posterior to the constriction. For stop consonants, complete closure is effected for a short interval. Immediately upon release of a stop consonant there is a brief period of turbulence noise generation near the constriction, followed by a transition into the following vowel. A rough indication of the acoustic properties that one would expect when stop or Fig. XVI-1. f 1 leb Idealized model of constricted vocal-tract configuration corresponding to a consonant. The constriction is adjusted to different positions to represent different places of articulation. fricative consonants are generated at different points within the vocal tract can be obtained by examining the natural frequencies of a constricted acoustic tube having the configuration shown in Fig. XVI-1. This idealized model of the vocal tract has a *This work was supported principally by the U. S. Air Force (Electronics Systems Division) under Contract AF 19(628)-5661; and in part by the National Institutes of Health (Grants 5 RO1 NB-04332-05 and 1 PO1 GM-14940-01), the Joint Services Electronics Programs (U. S. Army, U. S. Navy, and U. S. Air Force) under Contract DA 28-043-AMC-02536(E). QPR No. 89 199 (XVI. SPEECH COMMUNICATION) uniform cross-section area except at the constriction, which is formed by inserting in the tube a plug in which a narrow hole simulates the opening through which turbulent air flow can occur. The frication noise that is generated at the constriction acts as a source of excitation, and resonance peaks will be obtained in the output sound at the natural frequencies of the acoustic tube. Some resonances will be excited more strongly than others, particularly the resonances of the portion of the tube anterior to the constriction. It is of interest, therefore, to examine how the natural frequencies of the tube change as the constriction is moved to different points along the tube. If the constriction is sufficiently small, it can be assumed that the coupling between the resonances of the sections of the tube anterior and posterior to the constriction can be neglected, except when the resonant frequencies of the two sections are close together. The resonances of the anterior section, of length if, occur at frequencies c 43c 5c f f 4P ..... where c is the velocity of sound. We assume for purposes of this rough calf culation that the radiation impedance is negligible (compared with the characteristic impedance of the tube) and that there are no losses. The posterior section (of length fb) is terminated at both ends in an infinite impedance, and its resonances occur, therefore, at frequencies c c c .. 2 atb b b 2-b Let us consider a tube of total length 16 cm (roughly the length of the vocal tract for a male talker), with a constriction of length 3 cm. For this configuration, ff + b = 13 cm. The first two resonances of the front cavity, plotted as a function of b,' the length of the back cavity, are shown as dashed lines in Fig. XVI-2. The solid lines in the figure represent the resonant frequencies of the back cavity. Points of intersection of dashed and solid lines correspond to constriction positions for which computed values of front and back resonances are equal. Since the constriction provides some coupling between the two sections of the tube, the resonant frequencies cannot exactly coincide, but are split apart as shown by the dotted lines. The amount of separation of the two resonances at these points depends, of course, on the cross-section area of the constriction. For frequencies above approximately 5000 Hz, the front-cavity resonances will generally be highly damped, since the resistive component of the radiation impedance becomes comparable to the characteristic impedance of the tube when the diameter of tube becomes comparable to a quarter-wavelength (-1 cm at 5000 Hz). In addition to the resonances of the front and back portions of the tube, there are resonances of the constricted portion. For a constriction of length 3 cm, the lowest resonance of the constriction is at ~5700 Hz, under the assumption of negligible coupling to the front and back sections, and hence is above the frequency range shown in Fig. XVI-2. For a constriction of very small cross-section area, the lowest resonant frequency, or first formant, is essentially zero (except in the limiting case fb = 0). Consequently, QPR No. 89 200 (XVI. SPEECH COMMUNICATION) / - F40 3.0 z 2.0 F30 F / 3 3 - 0 z S2F 0© 2 1.0 0 .5 2 0 2 I 4 I 6 I 8 I 10 I 12 14 LENGTH OF BACK CAVITYeb (cm) Fig. XVI-2. Relations between natural frequencies and the position of the conThe over- all striction for the configuration shown in Fig. XVI-1. length of the tube is 16 cm and the length of the constriction is 3 cm. Dashed lines represent the two lowest resonances of the front cavity (anterior to the constriction); solid lines represent the three lowest resonances of the back cavity. Dotted lines near the points of coincidence of two resonances represent the resonant frequencies when there is a small amount of coupling between front and back cavities. The resonances of a 16-cm tube with no constriction are shown by the arrows at the right. The curves are labeled with the appropriate formant numbers. for each value of fb the resonances can be labeled, in order of increasing frequency, as F 2, F F 4 , etc., 3, representing the second and higher formant frequencies. The cavity with which a given formant number is associated depends upon the position of the constriction. For fb = 9. 5 cm, for example, F 2 is a half-wave resonance of the posterior cavity, while F 3 is a quarter-wave resonance of the anterior cavity. the cavity affiliations of F 2 For fb = 7 cm, and F 3 are interchanged. As we have noted, there are certain values of kb for which two formant frequencies are very close together. For the particular dimensions of the model of Fig. XVI-1, F = and F 3 coincide for fb = 8. 7 cm, F 10.4 cm (and also forb 3 and F 4 for fb = 5. 2 cm), and F 4 and F 5 for fb = 11. 1 cm. The acoustical behavior of a configuration for which front and back cavity resonances approximately coincide has rather special properties. Since the formant frequencies are spread apart in the manner shown by the dotted lines, there is a small range of values of fb surrounding each of these points within which there is no appreciable change in the formant frequencies. QPR No. 89 201 That is to say, (XVI. SPEECH COMMUNICATION) the formant frequencies are rather insensitive to perturbations in 2b within these regions. Furthermore, for such a configuration one would expect that one of the resonances would be rather strongly coupled to the velocity fluctuations in the turbulent flow. This would be the "antisymmetric" resonance (the higher of the two resonances of the coupled system) for which sound-pressure fluctuations on either side of the constriction are in opposite phases, and thus give rise to a relatively large velocity in the constriction. Thus for values of 2b corresponding to two coincident resonances, a maximum is obtained in the sound output and the resonant peak is relatively insensitive to small perturbations in the positions of the constriction. There exist, as it were, certain discrete or quantal constriction positions (places of articulation) that are optimal from the point of view of sound generation. It is of some interest, then, to examine whether these are indeed the places of articulation that are used in generating the fricative and stop consonants in various languages. The distances f b as read from the chart of Fig. XVI-2 cannot be expected to apply to the actual vocal-tract dimensions, since the model of Fig. XVI-1 is highly idealized. We note, however, that there are three values of 2b for which pairs of formant frequencies coincide below 5000 Hz. The most posterior of these, 2b = 8. 7 cm, corresponding to coincidence of F2 and F 3 , is roughly in the place of articulation for the consonants /k g/. The next critical value of fb is at the point of coincidence of F 3 and F 4 , and would correspond to the alveolar consonants /s z c j/ and to retroflex consonants such as /d s/, which occur in many languages. striction is where F 4 and F 5 The most anterior of the three points of concoincide, and would, perhaps, correspond to the point of articulation for /s z t d/. An indication as to whether or not these points of articulation correspond to the three quantal steps predicted by the theory can be obtained by examining acoustic data on the various consonants. One would expect to find that the spectrum of the frication noise following the release of /k/ and /g/ should be characterized by a peak in energy, and this peak should then split into the second and third formants during the transition into the following vowel. The separation of F2 and F 3 would occur as the size of the constriction is gradually increased from the consonantal configuration. For the consonants /s z c J/, on the other hand, the frication interval should be characterized by a major spectral peak at a somewhat higher frequency. This peak should split into F 3 and F 4 during the transition to the following vowel. Likewise, for the postdental consonants the major spectral peak should be at a still higher frequency, and should split into F 4 and F 5 during the transition to the following vowel. In order to verify these hypotheses, we have examined a number of consonant-vowel utterances by three speakers, drawn from an inventory of data that have been assembled previously.1 QPR No. 89 Spectral sections were examined (using a computer-generated display) 202 (XVI. SPEECH COMMUNICATION) Positions of spectral every 8 msec throughout relevant portions of the utterances. peaks were obtained simply through visual examination of the spectra. For each CV sequence, Examples of some of the data are displayed in Fig. XVI-3. the first sample is taken near the beginning of the consonant (at the instant of release in the case of stop consonants) and locations of major spectral peaks are plotted. Although the data that have been examined are relatively limited and the procedures for collecting the data are rather imprecise, it is evident that the predictions of the theory are subPostdentals (upper part of Fig. XVI-3) are articulated at a point stantially correct. that gives the major spectral peak in the range of F 4 and F examples shown) during the frication interval. the major concentration of energy is in the F3-F 5 (apparently at F 5 in the For alveolars (middle of Fig. XVI-3) 4 region. The fact that both of these resonances appear to be excited might suggest that the back cavity resonance is actually the resonance of the long constriction that is used in generating these sounds. Theoret- ical considerations would predict coupling of the turbulence noise source to both of these modes for this configuration. In the case of velars (lower section of Fig. XVI-3), the major energy concentration for the frication interval coincides with F nant precedes a back vowel, and with F Although there is a tendency for F 2 when the conso- when the consonant precedes a front vowel. 3 and F 2 3 to merge for the velars, the examples that have been examined suggest that this effect is not always evident. The curves shown in Fig. XVI-2 not only demonstrate that there are certain regions of coincidence of pairs of formants for consonants, but also provide an indication of the frequencies of the formants that would be expected at the start of the transition between a consonant and a following vowel. to coincidence of F 3 and F 4 Thus, for example, for a value of fb corresponding in the idealized model of Fig. XVI-1, frequency is ~1800 Hz, according to Fig. XVI-2. the second-formant With no constriction in the tube, the second resonance is ~1600 Hz (as shown by the arrow at the right). Thus as the cross- section area of the constriction increases from zero to the size of the larger tube the second formant falls from 1800 Hz to 1600 Hz. The second-formant frequency corre- sponding to the constricted configuration, of course, can be manipulated by changing the configuration of the back cavity. In the case of the / / configuration, the tongue is adjusted to give a tapered vocal-tract shape posterior to the constriction, yielding a second-formant frequency that is higher than the thereby value indicated in Fig. XVI-2. In general, it is evident that two kinds of acoustic variables can be manipulated in order to generate consonants at different places in the vocal tract. First, selection of the primary place of articulation is made by specifying the pair of formants that is approximately coincident. Once this selection is made, the absolute frequency at which the coincidence occurs and the initial frequencies of the formant transitions into the following vowel can be manipulated by adjusting the detailed shape of the vocal tract QPR No. 89 203 I i 1 [sE] 2-240 - F5 F4 F3 F2 -100 0 -100 100 0 [E] 2-270 F F3 F F2 -100 0 -100 100 0 100 0 100 [g] 1-114 F4 F3 o F2 TIME FROM ONSET OF VOICING (msec) Fig. XVI-3. QPR No. 89 Frequencies of spectral peaks for spectra sampled at a number of instants of time preceding and following the onset of voicing for several consonant-vowel syllables. Spectra were obtained from a 36-channel filter bank. Points on the curves represent frequencies of spectral peaks derived from visual observation of the spectra displayed on a computer oscilloscope. After voicing onset, the data represent the second and higher formant frequencies of the vowels. 204 (XVI. with the tongue and lips. SPEECH COMMUNICATION) Such manipulation would correspond to rounding, palatalization, velarization or pharyngealization of the consonant. These aspects of consonant produc- tion require further study, including examination of these classes of consonants as they occur in a variety of languages. Other consonant types that must be included in the scheme presented here are the labials /f v p b/ and the dentals /0 ~/. For the labials there is no anterior cavity, and hence there is no possibility of a coincidence of anterior and posterior resonances. Labial or labiodental fricatives show minor spectral peaks at frequencies corresponding to resonances of the posterior cavity, but these fricatives are of much lower intensity than sounds generated with a more posterior point of articulation. Labial stop conso- nants in initial position are also characterized by weak frication intervals with no pronounced spectral peaks. The dentals /0 /s 6/ are generated with a constriction position anterior to that for z/, and hence with an anterior cavity that is shorter. Thus there will be no coinci- dence of a pair of resonances in the frequency range below 5000 Hz, and the conditions for appreciable noise energy will not be met. It might be speculated that a coincidence between a pair of resonances in the manner we have described is a correlate of the feature stridency; lack of such a coincidence, therefore, would result in nonstrident consonant. Such a categorization would then identify labiodentals as nonstrident consonants. K. N. Stevens References A. S. House, "On Vowel Duration in English," J. Acoust. Soc. Am. 33, 1174-1178 (1961). QPR No. 89 205
