Risk Prediction of Invasive Plant Species Using Geospatial Models in...
advertisement
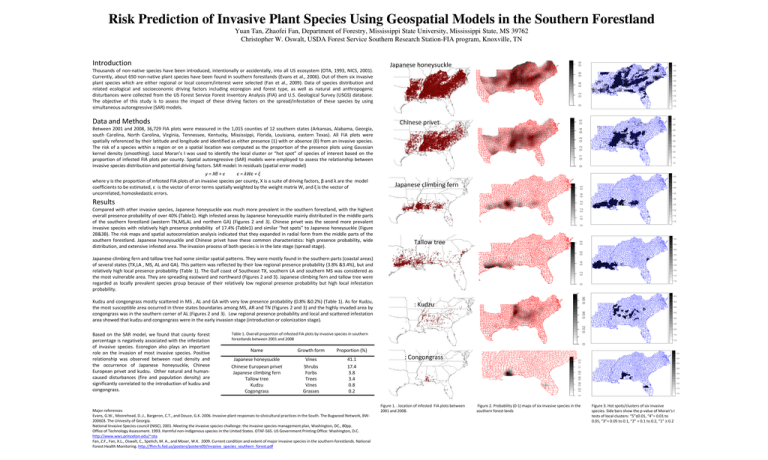
Risk Prediction of Invasive Plant Species Using Geospatial Models in the Southern Forestland Yuan Tan, Zhaofei Fan, Department of Forestry, Mississippi State University, Mississippi State, MS 39762 Christopher W. Oswalt, USDA Forest Service Southern Research Station-FIA program, Knoxville, TN Introduction Japanese honeysuckle Thousands of non-native species have been introduced, intentionally or accidentally, into all US ecosystem (OTA, 1993, NICS, 2001). Currently, about 650 non-native plant species have been found in southern forestlands (Evans et al., 2006). Out of them six invasive plant species which are either regional or local concern/interest were selected (Fan et al., 2009). Data of species distribution and related ecological and socioeconomic driving factors including ecoregion and forest type, as well as natural and anthropogenic disturbances were collected from the US Forest Service Forest Inventory Analysis (FIA) and U.S. Geological Survey (USGS) database. The objective of this study is to assess the impact of these driving factors on the spread/infestation of these species by using simultaneous autoregressive (SAR) models. Data and Methods Chinese privet Between 2001 and 2008, 36,729 FIA plots were measured in the 1,015 counties of 12 southern states (Arkansas, Alabama, Georgia, south Carolina, North Carolina, Virginia, Tennessee, Kentucky, Mississippi, Florida, Louisiana, eastern Texas). All FIA plots were spatially referenced by their latitude and longitude and identified as either presence (1) with or absence (0) from an invasive species. The risk of a species within a region or on a spatial location was computed as the proportion of the presence plots using Gaussian kernel density (smoothing). Local Moran’s I was used to identify the local cluster or “hot spot” of species of interest based on the proportion of infested FIA plots per county. Spatial autoregressive (SAR) models were employed to assess the relationship between invasive species distribution and potential driving factors. SAR model: In residuals (spatial error model) y = Xβ + ε ε = λWε + ξ where y is the proportion of infested FIA plots of an invasive species per county, X is a suite of driving factors, β and λ are the model coefficients to be estimated, ε is the vector of error terms spatially weighted by the weight matrix W, and ξ is the vector of uncorrelated, homoskedastic errors. Japanese climbing fern Results Compared with other invasive species, Japanese honeysuckle was much more prevalent in the southern forestland, with the highest overall presence probability of over 40% (Table1). High infested areas by Japanese honeysuckle mainly distributed in the middle parts of the southern forestland (western TN,MS,AL and northern GA) (Figures 2 and 3). Chinese privet was the second more prevalent invasive species with relatively high presence probability of 17.4% (Table1) and similar “hot spots” to Japanese honeysuckle (Figure 2B&3B). The risk maps and spatial autocorrelation analysis indicated that they expanded in radial form from the middle parts of the southern forestland. Japanese honeysuckle and Chinese privet have these common characteristics: high presence probability, wide distribution, and extensive infested area. The invasion process of both species is in the late stage (spread stage). Tallow tree Japanese climbing fern and tallow tree had some similar spatial patterns. They were mostly found in the southern parts (coastal areas) of several states (TX,LA , MS, AL and GA). This pattern was reflected by their low regional presence probability (3.8% &3.4%), but and relatively high local presence probability (Table 1). The Gulf coast of Southeast TX, southern LA and southern MS was considered as the most vulnerable area. They are spreading eastward and northward (Figures 2 and 3). Japanese climbing fern and tallow tree were regarded as locally prevalent species group because of their relatively low regional presence probability but high local infestation probability. Kudzu and congongrass mostly scattered in MS , AL and GA with very low presence probability (0.8% &0.2%) (Table 1). As for Kudzu, the most susceptible area occurred in three states boundaries among MS, AR and TN (Figures 2 and 3) and the highly invaded area by congongrass was in the southern corner of AL (Figures 2 and 3). Low regional presence probability and local and scattered infestation area showed that kudzu and congongrass were in the early invasion stage (introduction or colonization stage). Based on the SAR model, we found that county forest percentage is negatively associated with the infestation of invasive species. Ecoregion also plays an important role on the invasion of most invasive species. Positive relationship was observed between road density and the occurrence of Japanese honeysuckle, Chinese European privet and kudzu. Other natural and humancaused disturbances (fire and population density) are significantly correlated to the introduction of kudzu and congongrass. : Kudzu Table 1. Overall proportion of infested FIA plots by invasive species in southern forestlands between 2001 and 2008 Name Growth form Proportion (%) Japanese honeysuckle Chinese European privet Japanese climbing fern Tallow tree Kudzu Cogongrass Vines Shrubs Forbs Trees Vines Grasses 41.1 17.4 3.8 3.4 0.8 0.2 Major references Evans, G.W., Moorehead, D..J., Bargeron, C.T., and Douce, G.K. 2006. Invasive plant responses to silvicultural practices in the South. The Bugwood Network, BW200603. The Univesity of Georgia. National Invasive Species council (NISC). 2001. Meeting the invasive species challenge: the invasive species management plan, Washington, DC., 80pp. Office of Technology Assessment. 1993. Harmful non-indigenous species in the United States. OTAF-565. US Government Printing Office: Washington, D.C. http://www.wws.princeton.edu/~ota Fan, Z.F., Fan, X.L., Oswalt, C., Spetich, M. A., and Moser, W.K. 2009. Current condition and extent of major invasive species in the southern forestlands. National Forest Health Monitoring. http://fhm.fs.fed.us/posters/posters09/invasive_species_southern_forest.pdf : Congongrass Figure 1. . location of infested FIA plots between 2001 and 2008. Figure 2. Probability (0-1) maps of six invasive species in the southern forest lands Figure 3. Hot spots/clusters of six invasive species. Side bars show the p-value of Moran’s I tests of local clusters: “5”≤0.01, “4”= 0.01 to 0.05, “3”= 0.05 to 0.1, “2” = 0.1 to 0.2, “1” ≥ 0.2
