Estimation, Analysis, and Reporting of the Down Woody Materials Indicator
advertisement
Estimation, Analysis, and Reporting of the Down
Woody Materials Indicator
Christopher W. Woodall, North Central Research Station, USDA Forest Service, St. Paul, MN
Michael S. Williams, Rocky Mountain Research Station, USDA Forest Service, Ft. Collins, CO
Rectangular Slash Pile
24-foot FIA subplot
Subplot
FIA Phase 2
plot design
CWD
30
270
Intersecting
Sampling
Plane
24 feet (h.d.)
Three / subplot
2
150
Sample
Protocol
Theory
FWD (large)
3
4
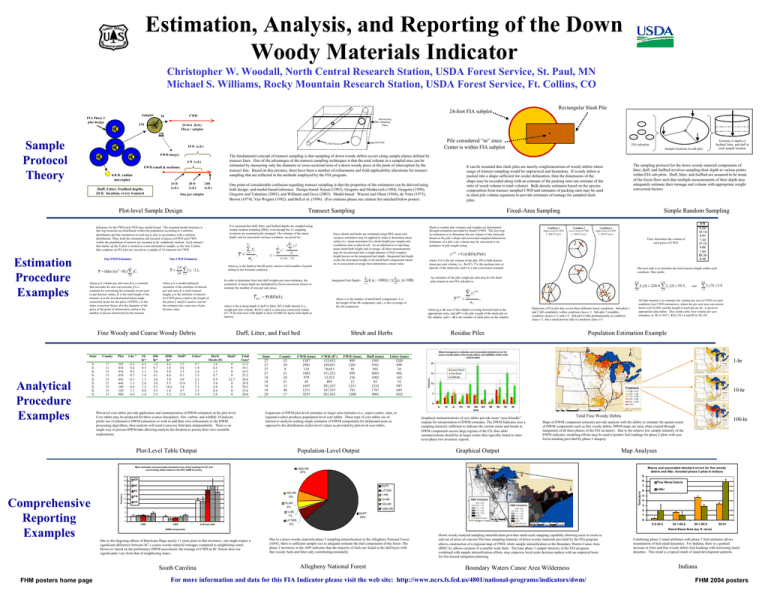
The fundamental concept of transect sampling is that sampling of down woody debris occurs along sample planes defined by
transect lines. One of the advantages of the transect sampling techniques is that the total volume in a sampled area can be
estimated by measuring only the diameter or cross-sectional area of a down woody piece at the point of interception by the
transect line. Based on this premise, there have been a number of refinements and field applicability alterations for transect
sampling that are reflected in the methods employed by the FIA program.
6 ft (s.d.)
FWD (small & medium)
6.8 ft. radius
microplot
14 ft
(s.d.)
Duff, Litter, Fuelbed depths
24 ft. location, every transect
20 ft
(s.d.)
24ft
(s.d.)
One per subplot
Transect Sampling
It is assumed that duff, litter, and fuelbed depths are sampled using
simple random sampling (SRS), even though the 12 sampling
locations are systematically arranged. The estimate of the mean
depth, and its associated variance estimator, are given by:
Inference for the FWD and CWD may model-based. The assumed model structure is
that log locations are distributed within the population according to a uniform
distribution and the orientation of each log is also in accordance with a uniform
distribution. Thus, both the orientation and location of pieces of FWD and CWD
within the population of interest are assumed to be completely random. Each transect
that makes up the Y-plot is treated as a non-informative sample, so the four Y-plots
that comprise an FIA plot are viewed as a sample of 12 transects for CWD.
One FWD Estimator
One CWD Estimator
n
y=
y = (kfac )(π / 8 L)∑ d ,
2
2
i
i =1
fπ
2L
∑ yi
i =1
nf
nf
,
s =
2
y
∑y
i =1
2
i
−
(∑ yi )2
i =1
nf
n f (n f − 1)
,
where yi is the depth at the ith point, and n is total number of points
falling in the forested condition.
n
∑ ( yi / li ),
where y is a model-unbiased
estimator of the attribute of interest
per unit area, L is total transect
length, y is the attribute of interest
for CWD piece, l and is the length of
the piece i, and f is used to convert
the estimate into a per-acre of perhectare value.
In order to determine litter and duff weights-per-area estimates, the
estimators of mean depth are multiplied by fixed conversion factors to
estimate the number of tons per unit areas,
YDLF = y ( BD)(k ),
where is the y mean depth of duff or litter, BD is bulk density (i.e.,
weight per unit volume, lbs/ft3), and k is unit-area conversion values
(21.78 for tons/acre with depth in feet) (10,000 for kg/ha with depth in
meters).
Fine Woody and Coarse Woody Debris
State
County
Plot
1-hr *
X
X
X
X
X
X
X
X
X
17
31
31
31
31
31
31
31
31
385
434
436
439
442
446
109
120
900
0.2
0.4
0.5
0.7
0.1
1.1
0.9
1.3
0.4
10hr*
0.5
0.5
1.1
1.4
1.3
2.6
1.5
0.8
1.4
100hr*
1.9
0.7
2.6
4.1
2.6
3.0
9.3
5.5
3.3
1000hr*
2.6
1.0
5.0
4.6
3.0
5.5
10.4
1.8
3.2
The sampling protocol for the down woody material components of
litter, duff, and fuelbed involves sampling their depth at various points
within FIA sub-plots. Duff, litter, and fuelbed are assumed to be strata
of the forest floor such that multiple measurements of their depth may
adequately estimate their tonnage and volume with appropriate weight
conversion factors.
Slash or residue pile volumes and weights are determined
through estimators provided by Hardy (1996). The first step
in estimation is to determine the net volume of the slash pile
based on the pile’s shape and associated sampled dimensions.
Estimates of a pile’s net volume may be converted to an
estimator of pile weight using:
Condition 3
High Level of CWD
(> 600 ft3/acre)
Simple Random Sampling
Condition 1
Low Level of CWD
(< 200 ft3/acre)
Integrated Fuel Depth=
First, determine the volume of
each piece of CWD.
2
y pile = Vol ( BD)( P)(k )
where Vol is the net volume of the pile, BD is bulk density
(mass per unit volume, i.e., lbs/ft3), P is the packing ratio or
density of the slash pile, and k is a unit conversion constant.
1
The next task is to calculate the total transect length within each
condition. This yields
Litter*
5.3
5.6
3.5
9.1
4.9
15.6
3.8
4.7
17.8
0.7
1.9
1.6
3.3
2.2
2.1
3.3
1.5
1.9
Herb/
Shrub (ft)
1.0
0.3
1.3
0.7
0.5
5.6
0.8
0.4
2.8
Slash*
0
0
0
0
22.7
0
0
0
0
Total
Tons*
11.2
10.1
14.3
23.2
36.8
29.9
29.2
15.6
28.0
Plot-level core tables provide application and summarization of DWM estimators at the plot-level.
Core tables may be produced for three science disciplines: fire, carbon, and wildlife. If analysts
prefer use of alternative DWM estimators or wish to add their own refinements to the DWM
processing algorithms, then analysts will need to process field data independently. There is no
single way to process DWM data allowing analysts the freedom to pursue their own scientific
explorations.
State
27
27
27
27
18
18
18
18
29
County
12
29
8
21
10
21
13
40
17
i =1
i =1
where n is the number of shrub/herb components, hi is
the height of the ith component, and ci is the coverage of
the ith component.
CWD (ft3)
112,012
189,051
70,651
151,232
12,523
895
201,235
107,235
201,563
FWD (tons)
895
1201
50
895
236
12
1211
781
1200
Duff (tons)
1501
3501
502
2003
1002
85
1232
1787
3001
Population-Level Output
Mean estimates and associated standard errors of fuel loadings for SC and
surrounding states based on the 2001 DWM inventory
=
i =1
af
k (1)
4
j =1
,
Depiction of FIA plot that covers three different forest conditions. Sub-plots 1
and 2 fall completely within condition class c=1. Sub-plot 3 straddles
condition classes c=1 and c=2. Sub-plot 4 falls predominantly in condition
class c=1, but a small portion falls in condition class c=3.
Residue Piles
j
and
∑ L (3) = 3.4.
j =1
j
Population Estimation Example
1-hr
10-hr
Graphical summarizations of core tables provide more “user-friendly”
outputs for interpretation of DWM estimates. The DWM Indicator uses a
sampling intensity sufficient to indicate the current status and trends in
DWM components across large regions of the US, thus table
summarizations should be at larger scales than typically found in statelevel phase two inventory reports.
Total Fine Woody Debris
100-hr
Maps of DWM component estimates provide analysts with the ability to estimate the spatial extent
of DWM components such as fine woody debris. DWM maps are most often created through
integration of all three phases of the FIA inventory. Due to the relative low sample intensity of the
DWM indicator, modeling efforts may be used to predict fuel loadings for phase 2 plots with nonforest masking provided by phase 1 imagery.
Graphical Output
Map Analyses
Means and associated standard errors for fine woody
debris and litter, forested phase 3 plots in Indiana
1000-HR
20%
NC
14
SC
8
100-HR
6%
12
TN
10
DUFF
7
LITTER
6
Tons/acre
Tons/acre
GA
16
1-HR
10-HR
VA
10-HR
3%
6
1-HR
1%
4
2
0
FWD
CWD
Duff and Litter
100-HR
1000-HR
Due to the lingering effects of Hurricane Hugo nearly 11 years prior to this inventory, one might expect a
significant difference between SC’s coarse woody material tonnages compared to neighboring states.
However, based on the preliminary DWM assessment, the tonnage of CWD in SC forests does not
significantly vary from that of neighboring states.
Fine Wood Debris
Litter
5
4
3
2
DUFF
64%
1
0
LITTER
6%
0.0-30.0
30.1-60.0
60.1-90.0
90.0+
Stand Basal Area (sq. ft. /acre)
DWM Components
South Carolina
FHM posters home page
j =1
9
18
8
j
All that remains is to estimate the volume per acre of CWD on each
condition (see CWD estimators), where the per unit area conversion
factor is f=43,560, and the length of each pieces, lij , is given in
appropriate data tables. This yields cubic foot volume per acre
estimates of Y(1)=303.7, Y(2)=931.4 and Y(3)=30,130.
20
Comprehensive
Reporting
Examples
k (3)
k (2)
∑ L (1) = 224.9, ∑ L (2) = 59.5,
3
pile
Litter (tons)
1203
899
38
902
365
52
987
685
1023
Expansion of DWM plot-level estimates to larger area estimates (i.e., super-county, state, or
regional-scales) produces population-level core tables. These type of core tables are of
interest to analysts seeking single estimates of DWM components for delineated areas as
opposed to the distribution of plot-level values as provided by plot-level core tables.
Plot-Level Table Output
y
pile
∑ yi
where af is the area of the subplot covering forested land in the
appropriate units, and yipile is the pile weight of the slash pile on
the subplot, and i – th is the number of slash piles on the subplot.
Shrub and Herbs
CWD (tons)
1287
2901
125
1802
978
45
1687
1251
3251
An estimator of the pile weight per unit area for the slash
piles found on one FIA sub-plot is
n
Duff, Litter, and Fuel bed
Duff*
n
∑ (hi (ci / 100))} /{( ∑(ci )) / 100}
V ft
0.56
10.14
4.61
1.34
17.15
4.66
1.64
85.34
8.48
Condition 2
High Level of CWD
(> 600 ft3/acre)
i =1
n
where y is volume per unit area, k is a constant
that accounts for unit conversions, f is a
constant for converting the estimates to per-acre
or per-hectare values, L is the total length of the
transect, a is the non-horizontal (lean) angle
correction factor for the piece of FWD, c is the
slope correction factor, d is the diameter of the
piece at the point of intersection, and n is the
number of pieces intersected by the transect.
Analytical
Procedure
Examples
nf
nf
y=
Sample locations on sub-plot
Fixed-Area Sampling
Since shrubs and herbs are estimated using SRS, mean and
variance estimators may be applied in order to determine mean
values (i.e. mean maximum live shrub height) per sample unit
(condition class or plot-level). As an alternative to reporting
mean shrub/herb height and coverage, all these measurements
may be incorporated into a single measure of fuel complex
height known as the integrated fuel depth. Integrated fuel depth
scales the maximum height of all shrub/herb components based
on its associated coverage then determines a mean value:
Estimate of depth of
fuelbed, litter, and duff at
each sample location
FIA sub-plots
It can be assumed that slash piles are merely conglomerations of woody debris where
usage of transect sampling would be impractical and hazardous. If woody debris is
packed into a shape sufficient for ocular delineation, then the dimensions of the
shape may be recorded along with an estimate of the packing ratio (an estimate of the
ratio of wood volume to total volume). Bulk density estimates based on the species
composition from transect sampled CWD and estimates of packing ratio may be used
in slash pile volume equations to provide estimates of tonnage for sampled slash
piles.
One point of considerable confusion regarding transect sampling is that the properties of the estimators can be derived using
both design- and model-based inference. Design-based: Kaiser (1983), Gregoire and Monkevich (1984), Gregoire (1998),
Gregoire and Valentine (2003), and Williams and Gove (2003). Model-based: Warren and Olsen (1964), de Vries (1973),
Brown (1974), Van Wagner (1982), and Bell et al. (1996). (For citations please see citation list attached below poster)
Plot-level Sample Design
Estimation
Procedure
Examples
Pile considered “in” since
Center is within FIA subplot
Fuel Bed
CWD Pieces
10 ft (s.d.)
1
Due to a down woody materials phase 3 sampling intensification in the Allegheny National Forest
(ANF), there is sufficient sample size to adequate estimate the fuel components of the forest The
phase 3 inventory in the ANF indicates that the majority of fuels are found in the duff layer with
fine woody fuels and litter only contributing minimally.
Allegheny National Forest
Down woody material sampling intensification provides multi-scale mapping capability allowing users to zoom in
and out of areas of concern.The base sampling intensity of down woody materials provided by the FIA program
allows construction of a regional map of FWD, while sample intensification in the Boundary Waters Canoe Area
(BWCA), allows creation of a smaller scale fuels. The base phase 3 sample intensity of the FIA program,
combined with sample intensification efforts, may empower local-scale decision makers with an empirical basis
for fire-hazard mitigation planning.
Boundary Waters Canoe Area Wilderness
For more information and data for this FIA Indicator please visit the web site: http://www.ncrs.fs.fed.us/4801/national-programs/indicators/dwm/
Combining phase 2 stand attributes with phase 3 fuel estimates allows
examination of fuel:stand dynamics. For Indiana, there is a gradual
increase in litter and fine woody debris fuel loadings with increasing stand
densities. This trend is a typical result of stand development patterns.
Indiana
FHM 2004 posters
