Phytophthora ramorum Potential Susceptibility of Eastern Forests to Sudden Oak Death,
advertisement

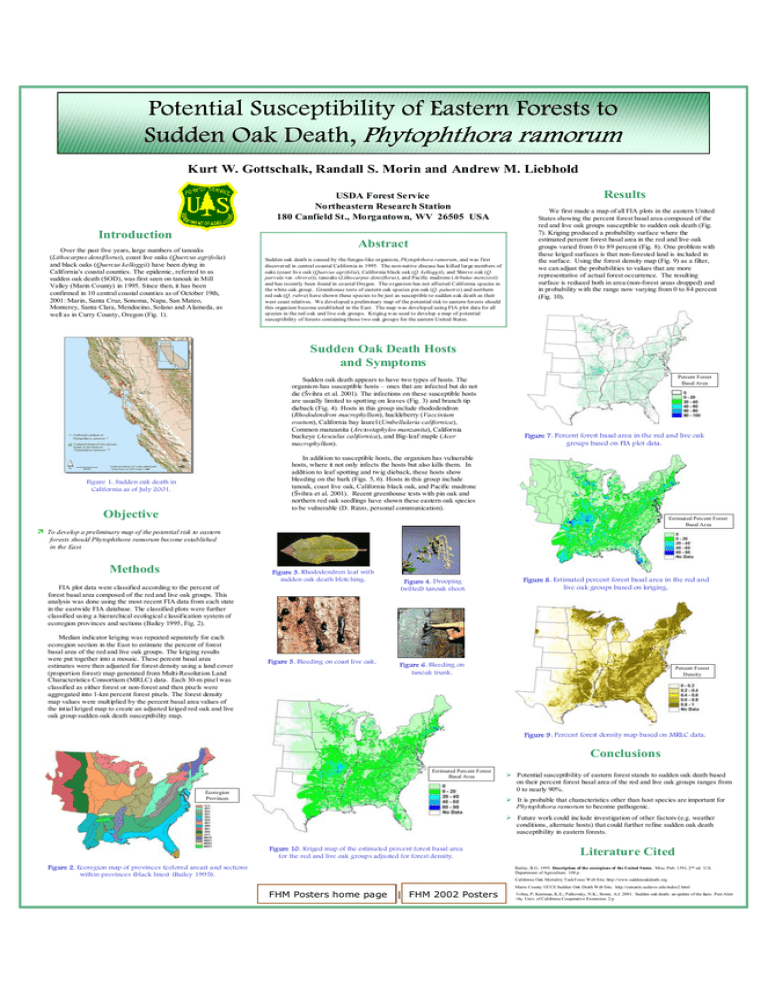
Potential Susceptibility of Eastern Forests to Sudden Oak Death, Phytophthora ramorum Kurt W. Gottschalk, Randall S. Morin and Andrew M. Liebhold USDA Forest Service Northeastern Research Station 180 Canfield St., Morgantown, WV 26505 USA Introduction Over the past five years, large numbers of tanoaks (Lithocarpus densiflorus), coast live oaks (Quercus agrifolia) and black oaks (Quercus kelloggii) have been dying in California's coastal counties. The epidemic, referred to as sudden oak death (SOD), was first seen on tanoak in Mill Valley (Marin County) in 1995. Since then, it has been confirmed in 10 central coastal counties as of October 19th, 2001: Marin, Santa Cruz, Sonoma, Napa, San Mateo, Monterey, Santa Clara, Mendocino, Solano and Alameda, as well as in Curry County, Oregon (Fig. 1). Abstract Sudden oak death is caused by the fungus-like organis m, Phytophthora ramorum, and was first discovered in central coastal California in 1995. The non-native disease has killed large numbers of oaks (coast live oak (Quercus agrifolia), California black oak (Q. kelloggii), and Shreve oak (Q. parvula var. shrevei)), tanoaks (Lithocarpus densiflorus), and Pacific madrone (Arbutus menziesii) and has recently been found in coastal Oregon. The organism has not affected California species in the white oak group. Greenhouse tests of eastern oak species pin oak (Q. palustr is) and northern red oak (Q. rubra) have shown these species to be just as susceptible to sudden oak death as their west coast relatives. We developed a preliminary map of the potential risk to eastern forests should this organism become established in the East. The map was developed using FIA plot data for all species in the red oak and live oak groups. Kriging w as used to develop a map of potential susceptibility of forests containing those two oak groups for the eastern United States. Results We first made a map of all FIA plots in the eastern United States showing the percent forest basal area composed of the red and live oak groups susceptible to sudden oak death (Fig. 7). Kriging produced a probability surface where the estimated percent forest basal area in the red and live oak groups varied from 0 to 89 percent (Fig. 8). One problem with these kriged surfaces is that non-forested land is included in the surface. Using the forest density map (Fig. 9) as a filter, we can adjust the probabilities to values that are more representative of actual forest occurrence. The resulting surface is reduced both in area (non-forest areas dropped) and in probability with the range now varying from 0 to 84 percent (Fig. 10). Sudden Oak Death Hosts and Symptoms Sudden oak death appears to have two types of hosts. The organism has susceptible hosts – ones that are infected but do not die (Švihra et al. 2001). The infections on these susceptible hosts are usually limited to spotting on leaves (Fig. 3) and branch tip dieback (Fig. 4). Hosts in this group include rhododendron (Rhododendron macrophyllum), huckleberry (Vaccinium ovatum), California bay laurel (Umbellularia californica), Common manzanita (Arctostaphylos manzanita), California buckeye (Aesculus californica), and Big-leaf maple (Acer macrophyllum). Percent Forest Basal Area Figure 7. Percent forest basal area in the red and live oak groups based on FIA plot data. In addition to susceptible hosts, the organism has vulnerable hosts, where it not only infects the hosts but also kills them. In addition to leaf spotting and twig dieback, these hosts show bleeding on the bark (Figs. 5, 6). Hosts in this group include tanoak, coast live oak, California black oak, and Pacific madrone (Švihra et al. 2001). Recent greenhouse tests with pin oak and northern red oak seedlings have shown these eastern oak species to be vulnerable (D. Rizzo, personal communication). Figure 1. Sudden oak death in California as of July 2001. Objective Estimated Percent Forest Basal Area Ê To develop a preliminary map of the potential risk to eastern forests should Phytophthora ramorum become established in the East. Methods Figure 3. Rhododendron leaf with sudden oak death blotching. FIA plot data were classified according to the percent of forest basal area composed of the red and live oak groups. This analysis was done using the most recent FIA data from each state in the eastwide FIA database. The classified plots were further classified using a hierarchical ecological classification system of ecoregion provinces and sections (Bailey 1995, Fig. 2). Median indicator kriging was repeated separately for each ecoregion section in the East to estimate the percent of forest basal area of the red and live oak groups. The kriging results were put together into a mosaic. These percent basal area estimates were then adjusted for forest density using a land cover (proportion forest) map generated from Multi-Resolution Land Characteristics Consortium (MRLC) data. Each 30-m pixel was classified as either forest or non-forest and then pixels were aggregated into 1-km percent forest pixels. The forest density map values were multiplied by the percent basal area values of the intial kriged map to create an adjusted kriged red oak and live oak group sudden oak death susceptibility map. Figure 5. Bleeding on coast live oak. Figure 4. Drooping (wilted) tanoak shoot. Figure 8. Estimated percent forest basal area in the red and live oak groups based on kriging. Figure 6. Bleeding on tanoak trunk. Percent Forest Density Figure 9. Percent forest density map based on MRLC data. Conclusions Estimated Percent Forest Basal Area Ecoregion Provinces ¾ Potential susceptibility of eastern forest stands to sudden oak death based on their percent forest basal area of the red and live oak groups ranges from 0 to nearly 90%. ¾ It is probable that characteristics other than host species are important for Phytophthora ramorum to become pathogenic. ¾ Future work could include investigation of other factors (e.g. weather conditions, alternate hosts) that could further refine sudden oak death susceptibility in eastern forests. Figure 10. Kriged map of the estimated percent forest basal area for the red and live oak groups adjusted for forest density. Figure 2. Ecoregion map of provinces (colored areas) and sections within provinces (black lines) (Bailey 1995). Literature Cited Bailey, R.G. 1995. Description of the ecoregions of the United States. Misc. Pub. 1391, 2nd ed. U.S. Department of Agriculture. 108 p. California Oak Mortality Task Force Web Site. http://www.suddenoakdeath.org FHM Posters home page | FHM 2002 Posters Marin County UCCE Sudden Oak Death Web Site. http://cemarin.ucdavis.edu/index2.html Švihra, P; Keirman, K.E.; Palkovsky, N.K.; Storer, A.J. 2001. Sudden oak death: an update of the facts. Pest Alert #4a. Univ. of California Cooperative Extension. 2 p.


