Document 11070179
advertisement
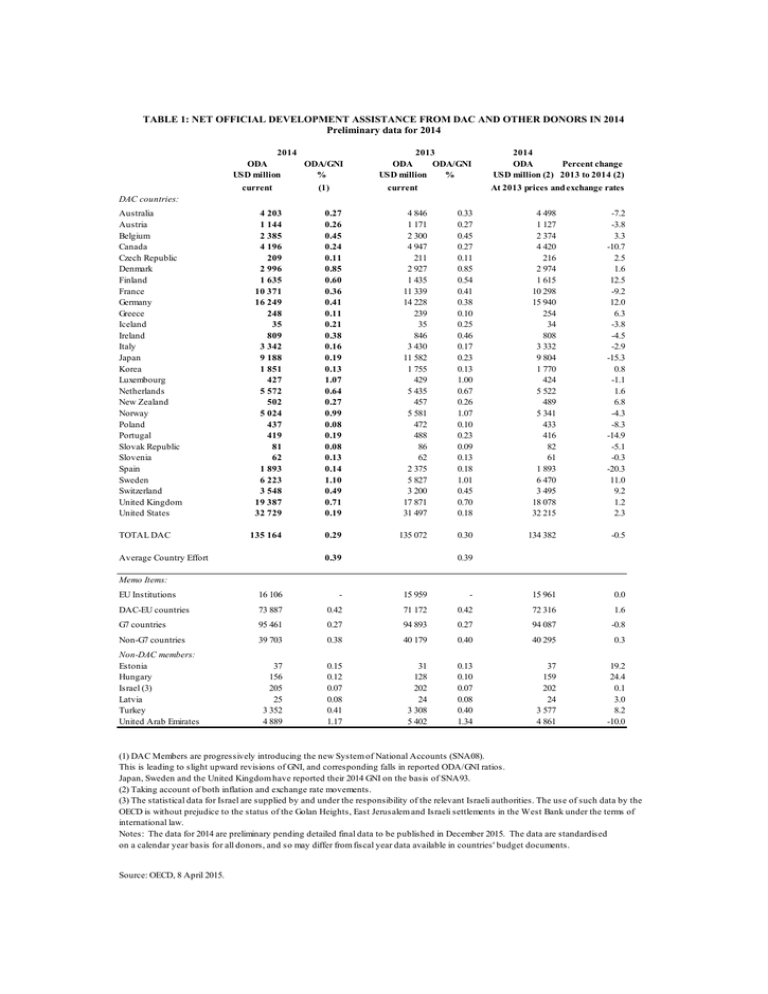
TABLE 1: NET OFFICIAL DEVELOPMENT ASSISTANCE FROM DAC AND OTHER DONORS IN 2014 Preliminary data for 2014 2014 ODA ODA/GNI USD million % current (1) 2013 ODA ODA/GNI USD million % current 2014 ODA Percent change USD million (2) 2013 to 2014 (2) At 2013 prices and exchange rates DAC countries: Australia Austria Belgium Canada Czech Republic Denmark Finland France Germany Greece Iceland Ireland Italy Japan Korea Luxembourg Netherlands New Zealand Norway Poland Portugal Slovak Republic Slovenia Spain Sweden Switzerland United Kingdom United States TOTAL DAC 4 203 1 144 2 385 4 196 209 2 996 1 635 10 371 16 249 248 35 809 3 342 9 188 1 851 427 5 572 502 5 024 437 419 81 62 1 893 6 223 3 548 19 387 32 729 0.27 0.26 0.45 0.24 0.11 0.85 0.60 0.36 0.41 0.11 0.21 0.38 0.16 0.19 0.13 1.07 0.64 0.27 0.99 0.08 0.19 0.08 0.13 0.14 1.10 0.49 0.71 0.19 4 846 1 171 2 300 4 947 211 2 927 1 435 11 339 14 228 239 35 846 3 430 11 582 1 755 429 5 435 457 5 581 472 488 86 62 2 375 5 827 3 200 17 871 31 497 0.33 0.27 0.45 0.27 0.11 0.85 0.54 0.41 0.38 0.10 0.25 0.46 0.17 0.23 0.13 1.00 0.67 0.26 1.07 0.10 0.23 0.09 0.13 0.18 1.01 0.45 0.70 0.18 4 498 1 127 2 374 4 420 216 2 974 1 615 10 298 15 940 254 34 808 3 332 9 804 1 770 424 5 522 489 5 341 433 416 82 61 1 893 6 470 3 495 18 078 32 215 -7.2 -3.8 3.3 -10.7 2.5 1.6 12.5 -9.2 12.0 6.3 -3.8 -4.5 -2.9 -15.3 0.8 -1.1 1.6 6.8 -4.3 -8.3 -14.9 -5.1 -0.3 -20.3 11.0 9.2 1.2 2.3 135 164 0.29 135 072 0.30 134 382 -0.5 0.0 Average Country Effort 0.39 0.39 Memo Items: EU Institutions 16 106 - 15 959 - 15 961 DAC-EU countries 73 887 0.42 71 172 0.42 72 316 1.6 G7 countries 95 461 0.27 94 893 0.27 94 087 -0.8 Non-G7 countries 39 703 0.38 40 179 0.40 40 295 0.3 37 156 205 25 3 352 4 889 0.15 0.12 0.07 0.08 0.41 1.17 31 128 202 24 3 308 5 402 0.13 0.10 0.07 0.08 0.40 1.34 37 159 202 24 3 577 4 861 19.2 24.4 0.1 3.0 8.2 -10.0 Non-DAC members: Estonia Hungary Israel (3) Latvia Turkey United Arab Emirates (1) DAC Members are progressively introducing the new System of National Accounts (SNA08). This is leading to slight upward revisions of GNI, and corresponding falls in reported ODA/GNI ratios. Japan, Sweden and the United Kingdom have reported their 2014 GNI on the basis of SNA93. (2) Taking account of both inflation and exchange rate movements. (3) The statistical data for Israel are supplied by and under the responsibility of the relevant Israeli authorities. The use of such data by the OECD is without prejudice to the status of the Golan Heights, East Jerusalem and Israeli settlements in the West Bank under the terms of international law. Notes: The data for 2014 are preliminary pending detailed final data to be published in December 2015. The data are standardised on a calendar year basis for all donors, and so may differ from fiscal year data available in countries' budget documents. Source: OECD, 8 April 2015. CHART 1: NET OFFICIAL DEVELOPMENT ASSISTANCE FROM DAC DONORS IN 2014 Preliminary data for 2014 USD billion Net ODA in 2014 - amounts 35 32.73 135.2 30 25 19.39 20 16.25 15 10.37 9.19 10 6.22 5.57 5.02 5 4.20 4.20 3.55 3.34 3.00 2.38 1.89 1.85 1.63 1.14 0.81 0.50 0.44 0.43 0.42 0.25 0.21 0.08 0.06 0.04 0 Net ODA in 2014 - as a percentage of GNI As % of GNI 1.2 1.10 1.1 1.0 0.9 1.07 0.99 0.85 0.8 UN Target 0.7 0.71 0.7 0.6 0.5 0.4 0.3 0.2 0.1 0.0 Source: OECD, 8 April 2015. 0.64 0.60 0.49 0.45 0.41 0.380.36 Average country effort 0.39 0.27 0.27 0.26 0.29 0.24 0.21 0.19 0.19 0.19 0.16 0.14 0.13 0.13 0.11 0.11 0.08 0.08 CHART 2: COMPONENTS OF DAC DONORS’ NET OFFICIAL DEVELOPMENT ASSISTANCE 160 Constant 2013 USD billion 140 120 100 80 60 40 20 0 2000 2001 2002 2003 2004 2005 2006 2007 2008 2009 2010 2011 2012 2013 2014 prel. Net debt relief grants Humanitarian aid Multilateral ODA Bilateral development projects, programmes and technical co-operation Source: OECD, 8 April 2015. CHART 3: SHARE OF TOTAL ODA GOING TO LEAST DEVELOPED COUNTRIES 160 140 Constant 2013 USD billion 120 100 80 60 40 20 0 Total ODA to LDCs Source: OECD, 8 April 2015. Total ODA TABLE 2: GROSS OFFICIAL DEVELOPMENT ASSISTANCE IN 2014 Preliminary data for 2014 2014 ODA USD million current 2013 ODA USD million current 4 211 1 145 2 385 4 242 209 3 047 1 635 12 315 18 911 248 35 809 3 405 15 630 1 932 431 5 725 502 5 406 458 463 81 62 2 129 6 230 3 592 20 093 33 617 4 924 1 176 2 357 4 990 211 3 101 1 435 12 880 16 221 239 35 846 3 510 22 527 1 821 433 5 613 457 5 672 491 528 86 62 2 604 5 892 3 226 18 286 32 385 4 507 1 128 2 374 4 468 216 3 025 1 615 12 229 18 552 254 34 808 3 394 16 677 1 848 429 5 673 489 5 747 454 459 82 61 2 128 6 477 3 539 18 737 33 089 -8.5 -4.1 0.7 -10.5 2.5 -2.5 12.5 -5.1 14.4 6.3 -3.8 -4.5 -3.3 -26.0 1.5 -0.9 1.1 6.8 1.3 -7.6 -13.0 -5.1 -0.3 -18.3 9.9 9.7 2.5 2.2 148 947 152 007 148 492 -2.3 EU Institutions 18 171 17 480 18 007 3.0 DAC-EU countries 79 780 75 970 78 094 2.8 108 212 110 799 107 146 -3.3 40 735 41 209 41 346 0.3 Australia Austria Belgium Canada Czech Republic Denmark Finland France Germany Greece Iceland Ireland Italy Japan Korea Luxembourg Netherlands New Zealand Norway Poland Portugal Slovak Republic Slovenia Spain Sweden Switzerland United Kingdom United States TOTAL DAC 2014 ODA Percent change USD million (1) 2013 to 2014 (1) At 2013 prices and exchange rates Memo Items: G7 countries Non-G7 countries (1) Taking account of both inflation and exchange rate movements. Notes: The data for 2014 are preliminary pending detailed final data to be published in December 2015. The data are standardised on a calendar year basis for all donors, and so may differ from fiscal year data available in countries' budget documents. Source: OECD, 8 April 2015. CHART 4: CPA BY INCOME GROUP Source: OECD, 8 April 2015. TABLE 3: CPA BY REGION Region Actual Preliminary 2013 2014 Projected 2015 2016 2017 2018 2013 USD million Europe Africa 4 559 5 558 4 516 4 737 4 815 4 663 49 980 45 952 47 078 48 253 47 922 47 613 North of Sahara 9 095 7 661 7 281 7 440 7 509 7 481 South of Sahara 39 396 36 492 37 983 38 957 38 560 38 307 Africa, regional/multi-country 1 489 1 798 1 814 1 855 1 853 1 825 America 8 786 8 683 7 928 8 107 8 048 7 849 North and Central America 4 334 4 177 3 901 3 968 3 950 3 862 South America 3 925 4 144 3 580 3 674 3 638 3 528 527 362 447 466 460 459 America, regional/multi-country Asia 47 846 43 331 44 903 45 356 45 690 45 389 Middle East 11 723 9 972 10 205 10 022 10 107 10 098 South and Central Asia 23 417 21 051 22 284 22 692 22 798 22 622 Far and East Asia 12 051 11 524 11 462 11 645 11 770 11 623 655 784 952 995 1 015 1 047 2 110 1 820 1 883 1 913 1 935 1 964 113 282 105 343 106 307 108 366 108 411 107 479 - - 1 721 1 770 1 800 1 534 113 282 105 343 108 028 110 136 110 211 109 013 Asia, regional/multi-country Oceania All developing countries Thematic to be programmed Grand Total Source: OECD, 8 April 2015.
