PATHSAS: A SAS Computer Program for Path Coefficient Analysis of Quantitative Data
advertisement

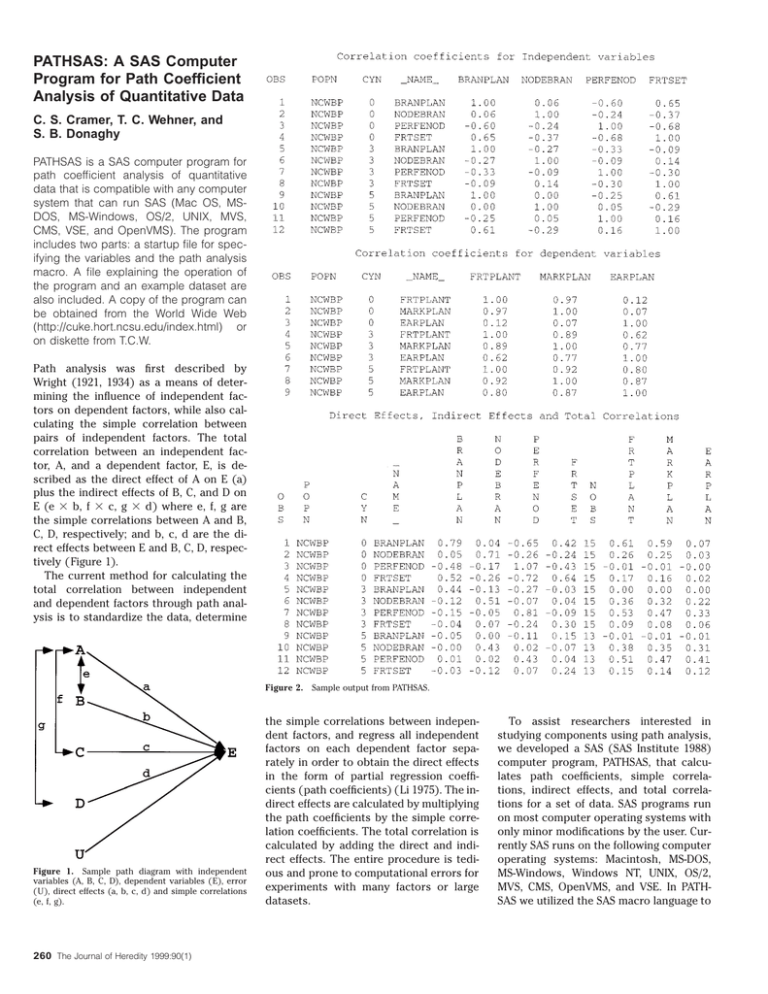
PATHSAS: A SAS Computer Program for Path Coefficient Analysis of Quantitative Data C. S. Cramer, T. C. Wehner, and S. B. Donaghy PATHSAS is a SAS computer program for path coefficient analysis of quantitative data that is compatible with any computer system that can run SAS (Mac OS, MSDOS, MS-Windows, OS/2, UNIX, MVS, CMS, VSE, and OpenVMS). The program includes two parts: a startup file for specifying the variables and the path analysis macro. A file explaining the operation of the program and an example dataset are also included. A copy of the program can be obtained from the World Wide Web (http://cuke.hort.ncsu.edu/index.html) or on diskette from T.C.W. Path analysis was first described by Wright (1921, 1934) as a means of determining the influence of independent factors on dependent factors, while also calculating the simple correlation between pairs of independent factors. The total correlation between an independent factor, A, and a dependent factor, E, is described as the direct effect of A on E (a) plus the indirect effects of B, C, and D on E (e 3 b, f 3 c, g 3 d) where e, f, g are the simple correlations between A and B, C, D, respectively; and b, c, d are the direct effects between E and B, C, D, respectively ( Figure 1). The current method for calculating the total correlation between independent and dependent factors through path analysis is to standardize the data, determine Figure 2. Sample output from PATHSAS. Figure 1. Sample path diagram with independent variables (A, B, C, D), dependent variables ( E), error ( U), direct effects (a, b, c, d) and simple correlations (e, f, g). 260 The Journal of Heredity 1999:90(1) the simple correlations between independent factors, and regress all independent factors on each dependent factor separately in order to obtain the direct effects in the form of partial regression coefficients (path coefficients) ( Li 1975). The indirect effects are calculated by multiplying the path coefficients by the simple correlation coefficients. The total correlation is calculated by adding the direct and indirect effects. The entire procedure is tedious and prone to computational errors for experiments with many factors or large datasets. To assist researchers interested in studying components using path analysis, we developed a SAS (SAS Institute 1988) computer program, PATHSAS, that calculates path coefficients, simple correlations, indirect effects, and total correlations for a set of data. SAS programs run on most computer operating systems with only minor modifications by the user. Currently SAS runs on the following computer operating systems: Macintosh, MS-DOS, MS-Windows, Windows NT, UNIX, OS/2, MVS, CMS, OpenVMS, and VSE. In PATHSAS we utilized the SAS macro language to Currently pathsas.sas uses two macros, analyze and path, to analyze the data. The analyze macro is used to standardize the data, to run regression analysis, and to calculate simple correlations. In addition, the analyze macro organizes the data and groups it into tables. The path macro also conducts regression analysis, and calculates simple correlations, in addition to conducting the bootstrap analysis. To our knowledge, there are no other SAS programs for calculating path coefficients for quantitative genetic data. SAS currently offers a path analysis procedure, CALIS, which is intended more for social sciences than for natural sciences. In addition, SEGPATH, has been developed for segregation and path analysis of genetic epidemiological models (Province and Rao 1995). PATHSAS has been used successfully in cucumber (Cucumis sativus L.) to calculate the path coefficients and correlations between yield components and fruit yield (Cramer and Wehner 1998). PATHSAS is distributed free of charge. A sample file is available that illustrates the use of the two macros. The program, startup, readme, and sample files can be obtained from the Web at http://cuke.hort. ncsu.edu/index.html, or by sending a blank diskette to T.C.W. Figure 2. Continued. standardize the data, calculate simple correlation and regression coefficients, calculate total correlations, and present the results in a table format that is easy to read ( Figure 2). To use PATHSAS, the user adjusts the startup.sas file ( Figure 3) to their needs. The user enters the names of the desired dataset and input variables, the number and names of independent, dependent, and BY (sorting) variables. In addition, the user can output full regression analysis, simple correlations of independent and dependent variables, path coefficients, indirect effects, total correlations, and bootstrap correlation estimates (along with 95% confidence intervals for those estimates). In addition, PATHSAS will notify the user when the number of observations for regression analysis is insufficient to perform the analysis. Error variation can be estimated by us- ing PATHSAS to calculate the confidence interval of each total correlation estimate. PATHSAS uses BOOTSTRAP analysis from the SAS statistical package (SAS Institute 1988) to calculate a total correlation estimate and a confidence interval for each estimate. The number of resampling events is set at the recommended level of 1000, but can be set to any number by the user. The user must specify a random number seed to initiate the bootstrap analysis. BOOTSTRAP analysis can take several h to complete and also can use an extensive amount of computer random access memory (RAM) depending upon the number of resampling events. The user will need to access jackboot.sas from the SAS Institute Web page ( http://www.sas. com/service/techsup/stat/jackboot.html). This file must be stored with PATHSAS (pathsas.sas) in order for BOOTSTRAP analysis to function. From the Departments of Horticultural Science (Cramer and Wehner) and Statistics ( Donaghy), North Carolina State University, Raleigh, NC 27695. C. S. Cramer is currently at the Department of Agronomy and Horticulture, New Mexico State University, Las Cruces, New Mexico. The research reported herein was funded in part by the North Carolina Agricultural Research Service. Use of trade names in this publication does not imply endorsement by the NCARS or the products named nor criticism of similar ones not mentioned. Address correspondence to T. C. Wehner at the address above. q 1999 The American Genetic Association References Cramer CS and Wehner TC, 1998. Fruit yield and yield component means and correlations of four slicing cucumber populations improved through six to ten cycles of recurrent selection. J Amer Soc Hort Sci 123: 388–395. Li CC, 1975. Path analysis—a primer. Pacific Grove, California: Boxwood Press. Province MA and Rao DC, 1995. General purpose model and a computer program for combined segregation and path analysis (SEGPATH): automatically creating computer programs from symbolic language model specifications. Gen Epidemiol 12:203–219. SAS Institute, 1988. SAS/STAT user’s guide, release 6.03. Cary, North Carolina: SAS Institute. Wright S, 1921. Correlation and causation. J Agric Res 20:557–585. Wright S, 1934. The method of path coefficients. Ann Math Stat 5:161–215. Received January 21, 1998 Accepted June 30, 1998 Corresponding Editor: Bruce S. Weir Computer Notes 261 Figure 3. Example of startup.sas file for PATHSAS output in Figure 2. 262 The Journal of Heredity 1999:90(1)


