NAEP Alignment with WV CSOs Mathematics, Grade 8 (83 NAEP Objectives)
advertisement
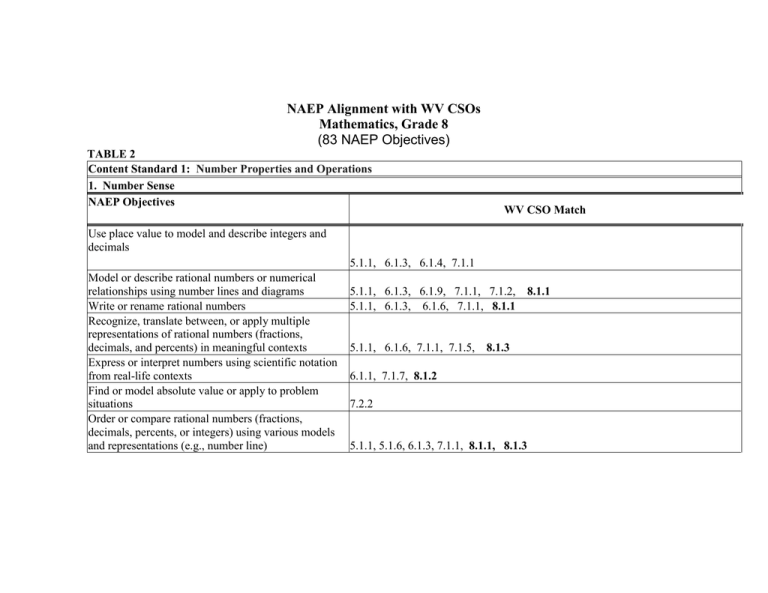
NAEP Alignment with WV CSOs Mathematics, Grade 8 (83 NAEP Objectives) TABLE 2 Content Standard 1: Number Properties and Operations 1. Number Sense NAEP Objectives WV CSO Match Use place value to model and describe integers and decimals 5.1.1, 6.1.3, 6.1.4, 7.1.1 Model or describe rational numbers or numerical relationships using number lines and diagrams Write or rename rational numbers Recognize, translate between, or apply multiple representations of rational numbers (fractions, decimals, and percents) in meaningful contexts Express or interpret numbers using scientific notation from real-life contexts Find or model absolute value or apply to problem situations Order or compare rational numbers (fractions, decimals, percents, or integers) using various models and representations (e.g., number line) 5.1.1, 6.1.3, 6.1.9, 7.1.1, 7.1.2, 5.1.1, 6.1.3, 6.1.6, 7.1.1, 8.1.1 5.1.1, 6.1.6, 7.1.1, 7.1.5, 8.1.3 8.1.1 6.1.1, 7.1.7, 8.1.2 7.2.2 5.1.1, 5.1.6, 6.1.3, 7.1.1, 8.1.1, 8.1.3 Order or compare rational numbers including very large and small integers, and decimals and fractions close to zero 5.1.1, 6.1.3, 7.1.1, 8.1.1, 8.1.3 2. Estimation Establish or apply benchmarks for rational numbers and 5.1.3, 6.1.3, 7.1.5, 8.1.3 common irrational numbers (e.g., ) in contexts Make estimates appropriate to a given situation by: identifying when estimation is appropriate, determining the level of accuracy needed, selecting the appropriate method of estimation, or 5.1.3, 6.1.4, 6.1.7, 7.1.5, 8.1.3 analyzing the effect of an estimation method on the accuracy of results Verify solutions or determine the reasonableness of results in a variety of situations including calculator and computer results 5.1.7, 5.1.11, 6.1.7, 6.1.9 7.1.5, 8.1.2, 8.1.3 Estimate square or cube roots of numbers less than 1,000 between two whole numbers 7.1.2, 8.1.2 3. Number Operations Perform computations with rational numbers 5.1.7, 5.1.8, 5.1.9, 5.1.11, 5.1.10, 6.1.4, 6.1.9, 7.1.3, 7.1.4, 8.1.3 Describe the effect of multiplying and dividing by numbers including the effect of multiplying or dividing a rational number by: zero, or a number less than zero, or a number between zero and one, one, or a number greater than one Provide a mathematical argument to explain operations with two or more fractions 6.1.8 5.1.6, 5.1.7, 5.1.11, 6.1.4, 7.1.3, 7.1.5, 8.1.3 Interpret rational number operations and the relationships between them Solve application problems involving rational numbers and operations using exact answers or estimates as appropriate 4. Ratios and proportional reasoning Use ratios to describe problem situations 5.1.7, 6.1.6, 7.1.3, 8.1.2, 8.1.3 5.1.7, 5.1.11, 6.1.4, 6.1.9, 7.1.5, 8.1.3 5.1.6, 5.1.11, 6.1.6, 6.5.3, 7.3.4, 8.2.2, 8.3.5 Use fractions to represent and express ratios and proportions Use proportional reasoning to model and solve problems (including rates and scaling) Solve problems involving percentages (including percent increase and decrease, interest rates, tax, discount, tips, or part/whole relationships) 5. Properties of number and operations 5.1.6, 6.1.6, 7.2.9, 7.3.4, 8.2.2, 8.3.5 6.2.5, 7.2.9, 7.3.4, 8.2.2, 8.3.5 6.1.7, 6.2.5, 7.1.5, 7.2.9, 8.3.5 Describe odd and even integers and how they behave under different operations Recognize, find, or use factors, multiples, or prime factorization 5.1.5, Recognize or use prime and composite numbers to solve problems 5.2.4, Use divisibility or remainders in problem settings 5.1.4 Apply basic properties of operations 5.1.8, Explain or justify a mathematical concept or relationship (e.g., 5.1.2, explain why 17 is prime) 8.1.1 Content Standard 2: Measurement 1. Measuring physical attributes Compare objects with respect to length, area, volume, angle measurement, weight, or mass 5.4.1, Estimate the size of an object with respect to a given measurement attribute (e.g., area) 5.4.1, Select or use appropriate measurement instrument to determine or create a given length, area, volume, angle, weight, or mass 5.4.1, Solve mathematical or real-world problem involving perimeter or area of plane figures such as triangles, rectangles, circles, or composite figures 5.4.2, Solve problems involving volume or surface area of rectangular solids, cylinders, prisms, or composite shapes 5.4.3, Solve problems involving indirect measurement such as finding the height of a building by comparing its shadow with the height and shadow of a known object 7.4.2, Solve problems involving rates such as speed or population density 6.2.5, 2. Systems of measurement 6.1.2, 7.1.2, 8.1.2 6.1.2 6.1.5, 7.1.4 5.1.4, 5.1.6, 5.1.9, 5.1.11, 6.1.4, 6.1.5, 7.1.1, 7.1.3 5.4.2, 5.4.6, 6.4.2, 6.4.4, 7.4.1, 8.3.5 5.4.6, 6.4.2, 6.4.3, 7.4.1 5.4.2, 5.4.3, 6.4.2, 6.4.3, 7.4.1, 5.4.4, 7.4.1, 8.4.2 6.4.2, 6.4.3, 6.4.4, 7.4.1, 8.4.1 8.4.3 7.1.5, 8.1.3 7.1.4, Select or use appropriate type of unit for the attribute being measured such as length, area, angle, time, or volume Solve problems involving conversions within the same measurement system such as conversions involving square inches and square feet Estimate the measure of an object in one system given the measure of that object in another system and the approximate conversion factor. For example: Distance conversion: 1 kilometer is approximately 5/8 of a mile Money conversion: US dollar is approximately 1.5 Canadian dollars Temperature conversion: Fahrenheit to Celsius Determine appropriate size of unit of measurement in problem situation involving such attributes as length, area, or volume Determine appropriate accuracy of measurement in problem situations (e.g., the accuracy of each of several lengths needed to obtain a specified accuracy of a total length) and find the measure to that degree of accuracy Construct or solve problems (e.g., floor area of a room) involving scale drawings Content Standard 3: Geometry 1. Dimension and shape Draw or describe a path of shortest length between points to solve problems in context Identify a geometric object given a written description of its properties Identify, define, or describe geometric shapes in the plane and in three-dimensional space given a visual representation 5.4.1, 5.4.3, 5.4.4, 5.4.5, 5.4.6, 5.4.7, 5.4.5, 7.4.3 5.4.2, 5.4.3, 6.4.2, 7.4.1, 8.4.1 7.4.1 5.3.5, 6.4.5, 7.3.5, 8.3.5 6.3.7, 7.2.6 5.3.1, 5.3.2, 6.3.1, 7.3.1, 8.3.2 5.3.2, 6.3.1, 7.3.6, 8.3.2 6.4.2, 6.4.3, 7.4.1 Draw or sketch from a written description polygons, circles, or 5.3.4 semicircles Represent or describe a three-dimensional situation in a twodimensional drawing from different views 5.3.2 Demonstrate an understanding about the two- and threedimensional shapes in our world through identifying, drawing, modeling, building, or taking apart 5.3.2, 2. Transformation of shapes and preservation of properties Identify lines of symmetry in plane figures or recognize and classify types of symmetries of plane figures 5.3.3, Recognize or informally describe the effect of a transformation on two-dimensional geometric shapes (reflections across lines of symmetry, rotations, translations, magnifications, and contractions). 6.3.5, Predict results of combining, subdividing, and changing shapes of plane figures and solids (e.g., paper folding, tiling, and cutting up and rearranging pieces) 6.3.5, Justify relationships of congruence and similarity, and apply these relationships using scaling and proportional reasoning 7.2.9, For similar figures, identify and use the relationships of conservation of angle and of , proportionality of side length 5.3.5, and perimeter 6.3.1, 7.3.6 6.3.4, 7.3.2 7.3.3, 8.3.4 7.3.6, 8.3.4 7.3.4, 8.3.5 7.3.4 3. Relationships between geometric figures Apply geometric properties and relationships in solving simple problems in two and three dimensions 5.3.1, 5.3.2, 6.3.6 Represent problem situations with simple geometric models to solve mathematical or real world problems 6.3.6 , 8.3.5 Use the Pythagorean theorem to solve problems Describe or analyze simple properties of, or relationships between, triangles, quadrilaterals, and other polygonal plane figures Describe or analyze properties and relationships of parallel or intersecting lines 4. Position and direction Describe relative positions of points and lines using the geometric ideas of midpoint, points on common line through a common point, parallelism or perpendicularity Describe the intersection of two or more geometric figures in the plane (e.g., intersection of a circle and a line) Visualize or describe the cross section of a solid 7.4.2, 8.4.3 6.3.1, 6.3.2 6.3.3, 8.3.1 6.3.3, 7.3.1, 8.3.3 6.3.3, 8.3.6 8.3.6 6.3.7 Represent geometric figures using rectangular coordinates on a plane 5. Mathematical reasoning Make and test a geometric conjecture about regular polygons 8.3.6 Content Standard 4: Data Analysis and Probability 1. Data representation (pictographs, bar graphs, circle graphs, line graphs, line plots, tables, and tallies) Read or interpret data, including interpolating or extrapolating from data 5.5.2, 5.5.3, 5.5.4, 6.5.1, 6.5.2, 7.5.3, 7.5.4, 8.5.3, 8.5.5 For a given set of data, complete a graph and then solve a problem using the data in the graph (histograms, line graphs, scatter plots, circle graphs, and bar graphs) 5.5.2, 5.5.3, 6.5.1, 6.5.2, 7.5.3, 7.5.4, 8.5.3, 8.5.5 Solve problems by estimating and computing with data from a 5.5.3, 5.5.4, 6.5.1, 6.5.2, 7.5.3, 7.5.4, 8.5.3, 8.5.5 single set or across sets of data 5.5.2, 5.5.3, 6.5.1, 7.5.3, 7.5.4 8.5.3, 8.5.5 Given a graph or a set of data, determine whether information is represented effectively and appropriately (histograms, line graphs, scatter plots, circle graphs, and bar graphs) Compare and contrast the effectiveness of different representations of the same data 5.5.2, 5.5.4, 6.5.1, 6.5.2, 7.5.3, 8.5.5 2. Characteristics of data sets Calculate, use, or interpret mean, median, mode, or range Describe how mean, median, mode, range, or interquartile ranges relate to the shape of the distribution 5.5.4, 6.5.2, 7.5.4, 8.5.5 5.5.4, 6.5.2, 7.5.4, 8.5.5 Identify outliers and determine their effect on mean, median, mode, or range 5.5.4, Using appropriate statistical measures, compare two or more data sets describing the same characteristic for two different populations or subsets of the same population 7.5.4, Visually choose the line that best fits given a scatter plot and 7.5.3, informally explain the meaning of the line. Use the line to make predictions 3. Experiments and samples Given a sample, identify possible sources of bias in sampling 8.5.4 Distinguish between a random and nonrandom sample 8.5.4 Evaluate the design of an experiment 5.5.1, 4. Probability Analyze a situation that involves probability of an independent event 5.5.1, Determine the theoretical probability of simple and compound events in familiar contexts 6.5.3, Estimate the probability of simple and compound events through experimentation or simulation 5.5.1, Use theoretical probability to evaluate or predict experimental outcomes 5.5.1, Determine the sample space for a given situation 5.5.1, Use a sample space to determine the probability of the possible outcomes of an event 5.5.1, Represent probability of a given outcome using fractions, decimals, and percents 5.5.1, Determine the probability of independent and dependent events. (Dependent events should be limited to linear functions with a small sample size.) 6.5.3, 6.5.2, 7.5.4, 8.5.5 8.5.5 8.5.3 8.5.4 6.5.3, 7.5.1 7.5.1, 8.5.2 6.5.3, 7.5.1, 8.5.2 6.5.3, 7.5.1, 8.5.2 6.5.4, 7.5.2. 8.5.1 6.5.3, 6.5.4, 7.5.2, 8.5.1 6.5.3, 8.5.2 7.5.1, 8.5.2 Interpret probabilities within a given context 5.5.1, Content Standard 5: Algebra 1. Patterns, relations, and functions Recognize, describe, or extend numerical and geometric patterns using tables, graphs, words, or symbols 5.2.1, Generalize a pattern appearing in a numerical sequence or table or graph using words or symbols 5.2.2, Analyze or create patterns, sequences, or linear functions given a rule 5.2.1, Identify functions as linear or nonlinear or contrast distinguishing properties of functions from tables, graphs, or equations 8.2.5 Interpret the meaning of slope or intercepts in linear functions 7.2.7, 2. Algebraic representations Translate between different representations of linear representations of linear expressions using symbols, graphs, tables, diagrams, or written descriptions 5.2.3, Analyze or interpret linear relationships expressed in symbols, graphs, tables, diagrams, or written descriptions 5.2.2, Graph or interpret points that are represented by ordered pairs of numbers on a rectangular coordinate system 7.2.6, Solve problems involving coordinate pairs on the rectangular coordinate system 7.2.6, Make, validate, and justify conclusions and generalizations about linear relationships 5.2.3, 6.5.3, 7.5.1, 8.5.2, 8.5.4 5.2.2, 6.2.2, 7.2.1, 8.2.5, 8.2.7 6.2.2, 6.2.4, 7.2.3, 8.2.5, 8.2.7 5.2.2, 6.2.4, 7.2.3, 8.2.5, 8.2.7 8.2.8 6.2.1, 7.2.5, 8.2.10 5.2.3, 6.2.1, 7.2.5, 8.2.5 8.2.6 8.2.6 6.2.4, 7.2.5, 8.2.1, 8.2.5 Identify or represent functional relationships in meaningful contexts including proportional, linear, and common nonlinear (e.g., compound interest, bacterial growth) in tables, graphs, words, or symbols 6.2.5, 6.2.6, 7.2.4, 7.2.9, 8.2.2, 8.2.5 3. Variables, expressions, and operations Write algebraic expressions, equations, or inequalities to represent a situation Perform basic operations, using appropriate tools, on linear algebraic expressions (including grouping and order or multiple operations involving basic operations, exponents, roots, simplifying, and expanding) 4. Equations and inequalities Solve linear equations or inequalities (e.g., ax + b = c or ax + b = cx + d or ax + b > c) Interpret “=” as an equivalence between two expressions and use this interpretation to solve problems Analyze situations or solve problems using linear equations and inequalities with rational coefficients symbolically or graphically (e.g., ax + b = c or ax + b = cx + d) Interpret relationships between symbolic linear expressions and graphs of lines by identifying and computing slope and intercepts (e.g., know in y = ax + b, that a is the rate of change and b is the vertical intercept of the graph) 5.2.3, 6.2.6, 7.2.2, 7.2.5, 8.2.1 5.2.3, 6.2.3, 7.1.3, 7.1.6 5.2.3, 6.2.1, 6.2.3, 7.2.5, 8.2.1 5.2.3, 6.2.3, 6.2.6, 7.2.5, 8.2.9 5.2.3,6.2.3, 6.2.6, 7.2.5, 8.2.1, 8.2.6 5.2.3, 7.2.7, 8.2.8, 8.2.10 Use and evaluate common formulas [e.g., relationship between a circle’s circumference and diameter (C = d), distance and time under constant speed] 5.4.2, 5.4.3, 6.4.1, 6.4.2, 7.4.1, 7.4.2, 8.4.1
