COUNTY BOARDS OF EDUCATION EXPENDITURES BY OBJECT OF EXPENDITURE
advertisement
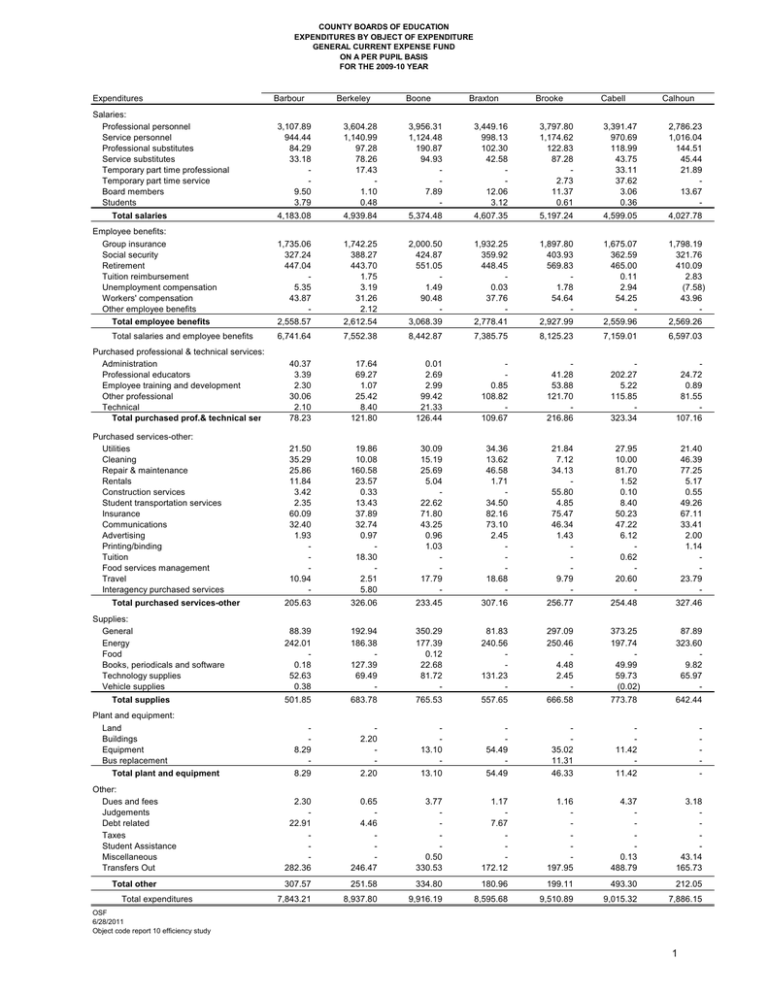
COUNTY BOARDS OF EDUCATION EXPENDITURES BY OBJECT OF EXPENDITURE GENERAL CURRENT EXPENSE FUND ON A PER PUPIL BASIS FOR THE 2009-10 YEAR Expenditures Salaries: Professional personnel Service personnel Professional substitutes Service substitutes Temporary part time professional Temporary part time service Board members Students Barbour Berkeley Boone Braxton Brooke Cabell Calhoun 3,107.89 944.44 84.29 33.18 9.50 3.79 3,604.28 1,140.99 97.28 78.26 17.43 1.10 0.48 3,956.31 1,124.48 190.87 94.93 7.89 - 3,449.16 998.13 102.30 42.58 12.06 3.12 3,797.80 1,174.62 122.83 87.28 2.73 11.37 0.61 3,391.47 970.69 118.99 43.75 33.11 37.62 3.06 0.36 2,786.23 1,016.04 144.51 45.44 21.89 13.67 - 4,183.08 4,939.84 5,374.48 4,607.35 5,197.24 4,599.05 4,027.78 1,735.06 327.24 447.04 5.35 43.87 - 1,742.25 388.27 443.70 1.75 3.19 31.26 2.12 2,000.50 424.87 551.05 1.49 90.48 - 1,932.25 359.92 448.45 0.03 37.76 - 1,897.80 403.93 569.83 1.78 54.64 - 1,675.07 362.59 465.00 0.11 2.94 54.25 - 1,798.19 321.76 410.09 2.83 (7.58) 43.96 - Total employee benefits 2,558.57 2,612.54 3,068.39 2,778.41 2,927.99 2,559.96 2,569.26 Total salaries and employee benefits 6,741.64 7,552.38 8,442.87 7,385.75 8,125.23 7,159.01 6,597.03 Purchased professional & technical services: Administration Professional educators Employee training and development Other professional Technical Total purchased prof.& technical serv. 40.37 3.39 2.30 30.06 2.10 78.23 17.64 69.27 1.07 25.42 8.40 121.80 0.01 2.69 2.99 99.42 21.33 126.44 0.85 108.82 109.67 41.28 53.88 121.70 216.86 202.27 5.22 115.85 323.34 24.72 0.89 81.55 107.16 Purchased services-other: Utilities Cleaning Repair & maintenance Rentals Construction services Student transportation services Insurance Communications Advertising Printing/binding Tuition Food services management Travel Interagency purchased services 21.50 35.29 25.86 11.84 3.42 2.35 60.09 32.40 1.93 10.94 - 19.86 10.08 160.58 23.57 0.33 13.43 37.89 32.74 0.97 18.30 2.51 5.80 30.09 15.19 25.69 5.04 22.62 71.80 43.25 0.96 1.03 17.79 - 34.36 13.62 46.58 1.71 34.50 82.16 73.10 2.45 18.68 - 21.84 7.12 34.13 55.80 4.85 75.47 46.34 1.43 9.79 - 27.95 10.00 81.70 1.52 0.10 8.40 50.23 47.22 6.12 0.62 20.60 - 21.40 46.39 77.25 5.17 0.55 49.26 67.11 33.41 2.00 1.14 23.79 - 205.63 326.06 233.45 307.16 256.77 254.48 327.46 88.39 242.01 0.18 52.63 0.38 192.94 186.38 127.39 69.49 - 350.29 177.39 0.12 22.68 81.72 - 81.83 240.56 131.23 - 297.09 250.46 4.48 2.45 - 373.25 197.74 49.99 59.73 (0.02) 87.89 323.60 9.82 65.97 - 501.85 683.78 765.53 557.65 666.58 773.78 642.44 8.29 - 2.20 - 13.10 - 54.49 - 35.02 11.31 11.42 - - 8.29 2.20 13.10 54.49 46.33 11.42 - 2.30 22.91 282.36 0.65 4.46 246.47 3.77 0.50 330.53 1.17 7.67 172.12 1.16 197.95 4.37 0.13 488.79 3.18 43.14 165.73 Total salaries Employee benefits: Group insurance Social security Retirement Tuition reimbursement Unemployment compensation Workers' compensation Other employee benefits Total purchased services-other Supplies: General Energy Food Books, periodicals and software Technology supplies Vehicle supplies Total supplies Plant and equipment: Land Buildings Equipment Bus replacement Total plant and equipment Other: Dues and fees Judgements Debt related Taxes Student Assistance Miscellaneous Transfers Out Total other Total expenditures 307.57 251.58 334.80 180.96 199.11 493.30 212.05 7,843.21 8,937.80 9,916.19 8,595.68 9,510.89 9,015.32 7,886.15 OSF 6/28/2011 Object code report 10 efficiency study 1 COUNTY BOARDS OF EDUCATION EXPENDITURES BY OBJECT OF EXPENDITURE GENERAL CURRENT EXPENSE FUND ON A PER PUPIL BASIS FOR THE 2009-10 YEAR Clay Salaries: Professional personnel Service personnel Professional substitutes Service substitutes Temporary part time professional Temporary part time service Board members Students 3,437.70 1,024.32 45.31 51.70 10.18 - 4,109.78 1,360.28 125.20 71.04 19.01 - 3,365.15 1,139.59 163.99 72.00 4.40 - 3,390.13 1,079.01 134.88 43.55 13.31 32.17 33.24 - 3,001.08 918.97 94.40 32.80 13.73 14.58 8.58 - 3,362.31 1,033.68 201.22 71.06 4.66 4.54 2,933.05 950.32 115.06 38.99 0.39 9.74 0.94 4,569.22 5,685.31 4,745.13 4,726.28 4,084.14 4,677.48 4,048.50 1,001.58 438.72 606.53 0.76 82.66 (1.43) 2,135.01 374.67 484.62 6.75 61.59 - 1,515.17 377.19 447.95 0.12 60.98 - 1,565.00 325.31 433.85 19.32 50.76 - 1,968.41 365.06 482.99 2.54 55.91 - 1,643.18 319.03 417.25 8.80 58.62 - Total salaries Employee benefits: Group insurance Social security Retirement Tuition reimbursement Unemployment compensation Workers' compensation Other employee benefits 779.85 333.37 425.30 0.85 69.69 - Doddridge Fayette Gilmer Grant Greenbrier On a Percentage Basis Hampshire Expenditures Total employee benefits 1,609.07 2,128.82 3,062.64 2,401.40 2,394.24 2,874.91 2,446.88 Total salaries and employee benefits 6,178.29 7,814.13 7,807.77 7,127.68 6,478.38 7,552.38 6,495.39 Purchased professional & technical services: Administration Professional educators Employee training and development Other professional Technical Total purchased prof.& technical serv. 81.21 59.67 140.88 41.13 2.16 91.05 134.34 0.11 7.35 69.02 0.09 76.57 86.37 86.37 52.91 36.54 89.45 1.19 179.92 23.16 204.27 33.46 51.57 85.03 Purchased services-other: Utilities Cleaning Repair & maintenance Rentals Construction services Student transportation services Insurance Communications Advertising Printing/binding Tuition Food services management Travel Interagency purchased services 24.89 16.93 0.86 130.83 79.05 33.57 1.00 41.93 - 28.44 37.75 200.31 1.51 7.11 71.95 52.59 2.80 18.82 30.65 - 29.28 18.39 56.60 1.56 48.20 0.73 51.12 49.65 5.87 3.34 7.98 7.24 11.56 62.12 240.38 40.97 47.23 62.76 48.62 12.43 46.16 18.98 26.63 11.76 29.62 6.60 9.89 8.75 7.29 60.90 29.32 0.99 1.28 12.23 - 28.67 0.17 66.57 2.91 11.32 2.56 69.00 36.27 2.66 2.92 0.11 21.16 0.02 29.88 28.11 130.64 0.37 2.26 59.14 24.83 1.18 25.33 - 329.06 451.95 279.96 617.85 178.63 244.34 301.72 134.73 214.91 1.16 - 230.64 265.45 20.02 13.80 12.23 111.04 239.52 59.22 116.19 0.61 250.89 316.04 43.08 75.47 - 61.77 231.06 17.10 - 199.26 254.51 0.52 37.18 66.68 22.19 139.77 200.61 34.37 63.81 4.92 524.32 692.36 648.90 816.38 409.31 689.84 552.78 23.72 - 0.87 114.42 54.63 10.62 8.67 7.23 32.22 44.30 - 90.48 - 19.41 23.33 - 23.72 180.55 15.90 32.22 44.30 90.48 42.74 50.11 - 1.81 286.22 1.48 18.63 11.57 860.19 1.89 267.64 13.23 0.09 0.05 0.02 303.93 3.20 0.22 312.38 1.83 53.47 66.43 4.74 165.87 Total purchased services-other Supplies: General Energy Food Books, periodicals and software Technology supplies Vehicle supplies Total supplies Plant and equipment: Land Buildings Equipment Bus replacement Total plant and equipment Other: Dues and fees Judgements Debt related Taxes Student Assistance Miscellaneous Transfers Out Total other Total expenditures 50.11 288.03 891.88 269.53 317.33 315.79 292.34 7,246.39 9,561.36 9,720.99 8,950.02 7,517.39 9,097.10 7,769.99 OSF 6/28/2011 Object code report 10 efficiency study 2 COUNTY BOARDS OF EDUCATION EXPENDITURES BY OBJECT OF EXPENDITURE GENERAL CURRENT EXPENSE FUND ON A PER PUPIL BASIS FOR THE 2009-10 YEAR Expenditures On a Percentage Basis Hancock Salaries: Professional personnel Service personnel Professional substitutes Service substitutes Temporary part time professional Temporary part time service Board members Students Hardy Harrison Jackson Jefferson Kanawha Lewis 4,099.70 1,146.24 136.63 76.11 16.77 9.14 - 2,977.75 751.05 84.87 46.61 8.09 3.37 10.36 - 3,579.59 1,134.11 56.03 38.81 3.35 - 3,419.51 1,102.04 122.56 59.53 1.26 13.74 4.61 9.38 3,874.66 1,220.08 180.81 117.04 3.27 0.01 3,521.43 1,063.23 109.45 44.04 10.95 49.66 1.43 - 3,541.54 1,217.58 119.57 66.17 2.74 14.09 - 5,484.60 3,882.10 4,811.88 4,732.63 5,395.86 4,800.19 4,961.68 1,010.10 408.19 556.80 1.64 74.06 - 1,471.53 307.86 405.60 13.58 45.09 - 1,747.25 379.33 521.11 1.39 57.91 - 1,718.92 370.54 492.24 0.73 66.95 - 1,813.76 420.82 503.38 6.67 70.64 - 1,723.93 378.36 480.28 3.52 51.00 - 1,842.73 389.50 494.41 1.17 47.53 0.74 Total employee benefits 2,050.79 2,243.66 2,706.99 2,649.38 2,815.27 2,637.08 2,776.09 Total salaries and employee benefits 7,535.38 6,125.76 7,518.88 7,382.01 8,211.13 7,437.27 7,737.77 Purchased professional & technical services: Administration Professional educators Employee training and development Other professional Technical Total purchased prof.& technical serv. 13.03 61.09 130.66 0.42 205.19 38.93 3.00 67.34 7.21 116.48 4.05 0.08 70.76 65.02 139.92 4.96 17.33 3.17 55.85 54.78 136.10 41.66 0.84 41.06 14.01 97.57 9.97 30.80 4.61 56.40 0.17 101.95 18.60 2.74 1.10 89.72 0.85 113.01 Purchased services-other: Utilities Cleaning Repair & maintenance Rentals Construction services Student transportation services Insurance Communications Advertising Printing/binding Tuition Food services management Travel Interagency purchased services 18.72 10.47 28.12 48.82 178.26 10.95 48.10 63.80 3.40 1.83 3.27 0.33 16.90 - 11.89 31.74 165.23 53.49 2.17 63.35 31.29 2.85 11.47 17.73 27.84 39.23 24.01 6.27 53.59 47.50 67.00 0.92 5.82 40.16 18.66 42.54 17.92 28.65 172.11 9.59 168.93 4.49 48.21 26.34 3.83 1.23 0.75 13.19 52.53 19.08 37.22 183.54 3.80 49.56 14.58 40.16 49.08 1.33 0.66 42.02 22.32 17.72 34.58 30.20 92.57 43.79 13.82 68.29 19.80 0.84 0.32 11.97 - 27.50 22.04 116.42 7.61 2.01 89.19 40.70 2.01 0.13 15.34 5.45 432.97 391.20 373.54 547.79 481.09 316.17 328.41 109.98 187.03 3.01 60.44 - 92.93 249.15 1.25 68.67 16.44 206.91 192.46 46.70 137.79 24.77 148.02 152.25 81.86 96.46 48.04 189.50 258.93 65.94 82.91 21.38 223.45 221.85 1.14 122.21 152.25 0.01 264.81 217.87 0.02 42.07 61.34 - 485.53 541.39 686.83 630.64 710.59 806.91 699.08 25.23 - 1.30 - 1.71 38.38 - 1.18 5.16 3.58 25.05 54.25 25.79 1.78 11.84 14.91 67.31 151.17 36.45 - 25.23 1.30 40.09 9.92 106.87 26.75 254.93 9.02 149.29 2.46 297.41 7.00 8.47 1.92 506.71 0.72 843.55 1.35 14.55 370.07 3.08 8.39 4.22 739.85 13.48 265.45 Total salaries Employee benefits: Group insurance Social security Retirement Tuition reimbursement Unemployment compensation Workers' compensation Other employee benefits Total purchased services-other Supplies: General Energy Food Books, periodicals and software Technology supplies Vehicle supplies Total supplies Plant and equipment: Land Buildings Equipment Bus replacement Total plant and equipment Other: Dues and fees Judgements Debt related Taxes Student Assistance Miscellaneous Transfers Out Total other Total expenditures 158.31 299.87 524.10 844.27 385.98 755.54 278.93 8,842.62 7,475.99 9,283.36 9,550.73 9,993.24 9,444.58 9,412.13 OSF 6/28/2011 Object code report 10 efficiency study 3 COUNTY BOARDS OF EDUCATION EXPENDITURES BY OBJECT OF EXPENDITURE GENERAL CURRENT EXPENSE FUND ON A PER PUPIL BASIS FOR THE 2009-10 YEAR Expenditures Salaries: Professional personnel Service personnel Professional substitutes Service substitutes Temporary part time professional Temporary part time service Board members Students Lincoln Logan Marion Marshall Mason McDowell Mercer 3,229.40 942.05 316.48 92.84 6.54 2.04 3,209.53 1,076.47 89.42 43.10 19.10 17.05 3.41 - 3,431.92 1,224.66 144.00 58.23 3.60 - 4,011.40 1,298.13 163.56 71.02 7.58 - 3,357.90 1,176.53 291.83 89.52 29.54 7.84 0.89 3,083.31 1,264.35 289.24 66.85 21.31 6.23 - 3,033.76 952.38 226.37 95.51 3.19 - 4,589.35 4,458.08 4,862.41 5,551.69 4,954.05 4,731.28 4,311.21 1,782.32 359.74 486.13 4.49 63.47 40.67 1,697.21 350.80 463.77 2.04 85.10 - 1,894.33 375.97 600.29 2.52 66.71 - 2,225.15 439.83 598.67 3.49 50.89 - 1,869.12 409.06 460.79 4.53 44.39 - 1,678.63 380.53 533.01 13.79 88.54 - 1,728.09 346.69 467.99 3.44 71.67 57.84 Total employee benefits 2,736.82 2,598.92 2,939.83 3,318.02 2,787.90 2,694.49 2,675.72 Total salaries and employee benefits 7,326.16 7,057.00 7,802.24 8,869.72 7,741.95 7,425.78 6,986.93 2.26 0.41 67.89 113.43 25.82 209.82 0.02 23.29 3.42 97.74 1.82 126.30 19.50 5.67 116.46 141.63 38.81 171.25 19.70 229.75 3.28 60.26 0.27 74.23 0.15 138.18 0.30 0.84 119.08 0.74 120.96 13.62 1.38 95.54 110.54 14.14 23.95 91.49 9.29 3.89 6.73 63.95 45.08 3.19 4.03 19.78 - 28.47 16.87 38.01 8.48 51.43 3.95 62.93 8.85 1.56 5.07 - 17.56 21.69 111.37 10.82 0.07 50.40 34.99 0.69 3.82 0.03 8.67 - 17.67 17.83 96.87 2.65 7.06 0.63 49.63 35.80 2.59 18.33 - 17.31 24.66 13.72 5.60 23.83 0.85 69.43 68.49 0.89 17.12 - 27.82 38.59 23.01 13.95 3.96 0.82 120.31 26.60 1.63 1.14 0.08 10.38 44.95 27.93 28.43 120.49 36.63 30.96 5.46 56.15 30.58 2.26 2.07 14.42 - 285.52 225.63 260.11 249.06 241.89 313.23 355.38 211.60 187.40 6.91 86.23 85.38 153.90 236.23 4.56 83.44 20.11 182.98 127.38 173.93 7.07 179.97 - 226.43 200.55 20.10 64.72 9.62 289.58 230.31 54.88 69.82 - 156.97 257.77 44.63 55.03 - 116.30 218.29 84.63 65.26 27.60 769.42 824.26 616.63 634.08 765.06 672.21 633.01 69.28 - 84.00 15.30 - 25.92 26.20 - 9.09 3.40 - 5.86 10.09 1.62 14.67 - 16.11 - 69.29 99.30 52.11 12.49 17.57 14.67 16.11 5.12 4.32 31.34 20.81 729.97 4.64 1.85 23.73 0.16 483.92 8.83 46.20 176.62 3.51 64.31 284.90 2.41 7.03 0.18 444.13 1.64 0.01 15.57 6.80 489.34 1.37 (0.03) 341.26 Total salaries Employee benefits: Group insurance Social security Retirement Tuition reimbursement Unemployment compensation Workers' compensation Other employee benefits Purchased professional & technical services: Administration Professional educators Employee training and development Other professional Technical Total purchased prof.& technical serv. Purchased services-other: Utilities Cleaning Repair & maintenance Rentals Construction services Student transportation services Insurance Communications Advertising Printing/binding Tuition Food services management Travel Interagency purchased services Total purchased services-other Supplies: General Energy Food Books, periodicals and software Technology supplies Vehicle supplies Total supplies Plant and equipment: Land Buildings Equipment Bus replacement Total plant and equipment Other: Dues and fees Judgements Debt related Taxes Student Assistance Miscellaneous Transfers Out Total other Total expenditures 791.56 514.30 231.65 352.72 453.75 513.36 342.60 9,451.77 8,846.78 9,104.37 10,347.83 9,358.41 9,060.20 8,444.58 OSF 6/28/2011 Object code report 10 efficiency study 4 COUNTY BOARDS OF EDUCATION EXPENDITURES BY OBJECT OF EXPENDITURE GENERAL CURRENT EXPENSE FUND ON A PER PUPIL BASIS FOR THE 2009-10 YEAR Expenditures Salaries: Professional personnel Service personnel Professional substitutes Service substitutes Temporary part time professional Temporary part time service Board members Students Mineral Mingo Monongalia Monroe Morgan Nicholas Ohio 3,528.53 1,100.83 124.08 55.04 0.66 18.47 6.54 0.72 3,491.39 1,214.25 238.54 132.69 2.93 - 3,442.14 1,093.47 136.18 60.69 0.28 4.11 3.52 - 3,236.76 1,106.38 158.05 89.59 37.96 5.03 16.46 - 3,563.33 1,060.81 151.73 67.44 12.22 7.97 7.98 1.46 3,476.91 1,067.36 126.03 51.34 8.87 - 3,698.00 1,208.30 147.24 87.62 4.90 16.76 5.55 - 4,834.88 5,079.80 4,740.40 4,650.24 4,872.93 4,730.50 5,168.36 1,787.49 380.65 543.78 2.14 45.24 - 1,864.42 405.52 474.95 5.54 108.69 - 1,780.38 371.64 491.46 0.97 61.16 - 906.85 363.34 449.79 1.31 16.04 50.85 - 1,791.84 378.71 453.70 21.52 0.57 56.55 - 854.58 369.67 500.13 6.26 69.15 - 1,863.44 404.93 545.89 2.03 91.37 - Total employee benefits 2,759.29 2,859.12 2,705.60 1,788.17 2,702.89 1,799.79 2,907.66 Total salaries and employee benefits 7,594.17 7,938.92 7,446.00 6,438.42 7,575.82 6,530.30 8,076.02 13.68 31.23 3.84 48.72 97.46 13.61 68.19 9.86 91.66 0.35 4.95 3.00 130.29 17.45 156.03 5.22 3.79 91.64 5.68 106.34 1.33 38.79 0.30 95.28 16.20 151.89 0.02 54.94 15.95 93.09 9.25 173.25 12.47 0.84 348.10 361.41 21.00 13.34 154.07 8.52 159.66 3.30 48.91 44.79 3.55 6.96 0.45 33.51 - 32.84 21.67 187.07 11.85 4.67 1.52 64.19 55.76 1.03 22.57 77.48 17.12 26.63 69.70 39.26 35.89 22.08 77.08 48.06 1.51 1.81 0.65 17.54 5.41 42.56 32.13 125.16 1.03 2.46 3.52 60.09 52.51 1.57 1.97 14.82 19.93 - 30.54 40.68 146.97 0.81 49.99 3.79 54.13 53.41 1.81 2.48 27.44 124.82 24.55 20.71 14.18 4.45 20.12 29.38 54.29 51.83 2.43 0.32 10.67 14.57 - 23.43 12.29 185.31 15.28 9.86 90.38 53.77 7.01 0.09 15.26 - 498.06 480.65 362.75 357.76 536.89 247.48 412.67 189.53 246.59 17.52 80.64 77.19 184.87 200.08 110.98 91.15 - 191.55 248.24 20.20 5.27 12.36 222.75 212.60 9.39 34.88 157.30 2.47 158.89 242.80 54.86 120.12 - 207.52 176.41 1.79 3.62 86.09 - 130.16 203.28 3.26 38.20 74.42 - 757.91 735.23 598.79 747.92 660.50 615.12 571.40 0.27 47.22 - 27.95 - 45.84 - 0.60 2.85 51.50 - 18.23 - 26.41 2.67 4.97 - 17.85 - 47.49 27.95 45.84 54.96 18.23 34.05 17.85 4.62 0.94 18.73 81.93 1.49 9.40 825.91 5.31 4.77 64.48 5.80 900.06 2.83 107.42 230.63 2.80 43.82 290.45 8.98 37.76 379.33 15.20 1.45 496.35 Total salaries Employee benefits: Group insurance Social security Retirement Tuition reimbursement Unemployment compensation Workers' compensation Other employee benefits Purchased professional & technical services: Administration Professional educators Employee training and development Other professional Technical Total purchased prof.& technical serv. Purchased services-other: Utilities Cleaning Repair & maintenance Rentals Construction services Student transportation services Insurance Communications Advertising Printing/binding Tuition Food services management Travel Interagency purchased services Total purchased services-other Supplies: General Energy Food Books, periodicals and software Technology supplies Vehicle supplies Total supplies Plant and equipment: Land Buildings Equipment Bus replacement Total plant and equipment Other: Dues and fees Judgements Debt related Taxes Student Assistance Miscellaneous Transfers Out Total other Total expenditures 106.23 836.80 980.41 340.88 337.07 426.07 513.01 9,101.31 10,111.22 9,589.83 8,046.26 9,280.41 8,026.26 9,952.36 OSF 6/28/2011 Object code report 10 efficiency study 5 COUNTY BOARDS OF EDUCATION EXPENDITURES BY OBJECT OF EXPENDITURE GENERAL CURRENT EXPENSE FUND ON A PER PUPIL BASIS FOR THE 2009-10 YEAR Expenditures Salaries: Professional personnel Service personnel Professional substitutes Service substitutes Temporary part time professional Temporary part time service Board members Students On a Per Pupil Basis Pleasants Pocahontas Pendleton Preston Putnam Raleigh Randolph 3,465.61 1,312.16 79.66 54.28 16.51 - 4,028.45 1,374.15 176.80 94.63 17.20 - 3,520.48 1,335.66 140.56 82.17 21.50 - 3,194.25 1,035.63 110.27 43.69 3.92 0.12 3,662.72 1,069.80 193.75 63.39 6.93 2.11 - 3,393.75 962.38 175.75 82.89 0.80 2.36 2.24 - 3,281.27 899.24 141.94 70.70 5.95 - 4,928.23 5,691.23 5,100.37 4,387.87 4,998.70 4,620.17 4,399.10 2,125.64 397.50 596.29 0.63 40.69 - 2,000.81 447.34 606.82 1.24 61.86 64.20 1,988.73 395.92 542.97 4.70 64.68 - 1,767.82 343.36 470.53 2.50 5.23 49.31 - 1,699.24 392.29 505.63 1.12 50.66 56.28 1,615.26 363.86 465.62 (1.23) 90.74 - 1,715.26 352.00 507.09 1.34 82.12 - Total employee benefits 3,160.76 3,182.27 2,997.00 2,638.75 2,705.24 2,534.26 2,657.82 Total salaries and employee benefits 8,088.99 8,873.50 8,097.37 7,026.62 7,703.93 7,154.43 7,056.92 Total salaries Employee benefits: Group insurance Social security Retirement Tuition reimbursement Unemployment compensation Workers' compensation Other employee benefits Purchased professional & technical services: Administration Professional educators Employee training and development Other professional Technical Total purchased prof.& technical serv. 0.43 131.56 131.99 4.95 40.13 181.99 (1.62) 225.45 13.02 117.51 130.53 73.56 1.64 50.00 0.37 125.58 1.16 73.58 0.46 56.74 2.44 134.38 24.68 0.14 97.08 22.10 144.00 9.18 4.97 2.05 112.50 2.14 130.85 Purchased services-other: Utilities Cleaning Repair & maintenance Rentals Construction services Student transportation services Insurance Communications Advertising Printing/binding Tuition Food services management Travel Interagency purchased services 25.28 23.68 29.48 14.71 730.50 49.15 81.18 54.48 1.45 0.92 22.43 21.08 46.31 180.97 3.14 0.02 69.15 72.88 5.30 1.72 7.64 29.02 101.49 18.36 21.50 28.13 5.52 3.81 91.79 86.54 2.94 1.76 21.28 - 22.21 50.30 47.69 21.26 169.50 0.41 56.18 28.05 2.67 0.89 9.62 - 36.29 14.64 93.43 14.54 83.66 8.32 47.03 35.69 3.52 4.16 15.86 - 25.91 11.21 126.54 3.90 81.88 8.15 72.08 53.36 1.55 0.79 0.02 11.48 45.04 20.41 15.93 27.43 2.29 276.33 0.03 65.36 50.00 1.24 0.62 0.26 6.73 - 1,054.34 517.64 281.63 408.79 357.14 441.90 466.63 63.61 291.29 2.23 10.67 7.14 148.29 271.33 0.06 2.62 247.40 - 138.70 314.24 62.03 16.61 92.59 227.31 (2.13) (0.17) 62.47 8.66 156.89 139.35 16.77 74.68 11.94 172.54 239.27 0.01 60.62 66.66 29.36 108.15 232.31 30.65 22.58 548.35 779.48 733.26 543.74 502.49 752.81 497.69 - 45.28 - - 36.45 - 35.19 18.02 - 11.10 9.78 33.03 - - 45.28 - 36.45 53.21 20.88 33.03 2.18 56.15 327.30 2.24 416.52 3.22 173.58 2.30 190.58 1.29 1.74 32.11 354.69 1.34 254.78 2.01 14.35 114.88 209.25 Total purchased services-other Supplies: General Energy Food Books, periodicals and software Technology supplies Vehicle supplies Total supplies Plant and equipment: Land Buildings Equipment Bus replacement Total plant and equipment Other: Dues and fees Judgements Debt related Taxes Student Assistance Miscellaneous Transfers Out Total other Total expenditures 385.63 418.75 176.80 192.88 389.84 256.11 340.49 10,209.30 10,860.10 9,419.60 8,334.06 9,141.00 8,770.12 8,525.62 OSF 6/28/2011 Object code report 10 efficiency study 6 COUNTY BOARDS OF EDUCATION EXPENDITURES BY OBJECT OF EXPENDITURE GENERAL CURRENT EXPENSE FUND ON A PER PUPIL BASIS FOR THE 2009-10 YEAR Expenditures Salaries: Professional personnel Service personnel Professional substitutes Service substitutes Temporary part time professional Temporary part time service Board members Students Ritchie Roane Summers Taylor Tucker Tyler Upshur 3,593.30 1,137.84 118.53 71.72 15.89 18.06 7.42 3,049.45 901.21 130.89 47.28 4.51 2.74 3,289.06 896.90 87.21 18.92 6.88 15.61 - 3,105.68 1,037.56 96.80 67.16 1.79 12.94 - 3,365.91 1,131.54 129.88 56.93 16.50 - 3,734.02 1,156.68 91.47 96.23 16.55 - 3,246.54 959.08 143.95 42.86 5.01 - 4,962.76 4,136.07 4,314.58 4,321.92 4,700.76 5,094.94 4,397.44 1,842.57 386.54 471.64 1.25 47.31 50.05 1,705.98 323.72 437.23 1.55 37.37 - 1,766.76 339.19 494.70 1.39 58.81 - 982.26 310.12 488.69 0.59 35.43 - 985.92 391.50 525.59 7.33 69.88 1.31 1,932.73 397.25 586.69 3.47 50.54 - 1,819.60 347.69 495.85 4.06 47.74 - Total employee benefits 2,799.36 2,505.86 2,660.85 1,817.10 1,981.54 2,970.70 2,714.94 Total salaries and employee benefits 7,762.12 6,641.93 6,975.43 6,139.02 6,682.30 8,065.64 7,112.38 122.64 3.38 54.04 47.92 227.99 2.74 1.65 43.64 48.03 3.10 163.37 166.47 22.77 1.11 29.22 21.48 74.59 4.50 67.37 64.03 135.90 21.46 6.07 44.23 12.77 84.52 5.35 41.68 207.89 1.29 256.22 15.11 23.91 10.69 5.55 4.14 64.55 54.07 4.83 57.70 22.28 - 21.19 23.15 12.47 4.07 101.63 22.77 63.08 37.69 1.97 4.64 (2.72) 52.50 28.09 34.49 2.53 0.61 49.79 32.73 1.76 1.08 6.04 - 19.07 19.55 53.64 9.36 49.87 0.56 60.95 23.71 2.95 1.27 12.51 - 35.82 24.68 137.43 24.92 58.29 63.79 1.46 17.99 - 32.18 20.31 233.37 11.74 75.86 0.03 81.24 33.60 1.99 51.61 27.36 - 29.63 18.77 54.18 3.29 8.73 0.45 63.47 28.92 0.89 4.01 106.73 8.39 10.63 262.83 289.95 209.61 253.42 364.37 569.28 338.09 215.18 216.71 3.70 98.00 108.44 - 108.48 171.94 67.49 0.01 63.50 241.87 0.08 73.88 16.83 159.01 219.21 53.53 75.59 - 245.97 341.88 25.50 258.49 243.34 98.81 106.12 - 254.73 169.50 28.96 140.50 - 770.37 484.82 567.74 616.13 766.27 854.22 706.14 1.25 2.99 - 7.74 - 0.51 3.47 23.39 7.13 5.20 53.57 18.61 22.79 14.73 0.59 157.41 12.72 - 4.24 7.74 0.51 34.00 58.77 56.72 170.13 3.60 278.02 1.47 11.49 341.09 3.66 10.69 224.00 2.11 59.00 226.31 2.17 - 52.88 214.12 1.97 77.47 104.89 16.73 Total salaries Employee benefits: Group insurance Social security Retirement Tuition reimbursement Unemployment compensation Workers' compensation Other employee benefits Purchased professional & technical services: Administration Professional educators Employee training and development Other professional Technical Total purchased prof.& technical serv. Purchased services-other: Utilities Cleaning Repair & maintenance Rentals Construction services Student transportation services Insurance Communications Advertising Printing/binding Tuition Food services management Travel Interagency purchased services Total purchased services-other Supplies: General Energy Food Books, periodicals and software Technology supplies Vehicle supplies Total supplies Plant and equipment: Land Buildings Equipment Bus replacement Total plant and equipment Other: Dues and fees Judgements Debt related Taxes Student Assistance Miscellaneous Transfers Out Total other Total expenditures 281.62 354.05 238.34 287.42 2.17 266.99 201.05 9,309.16 7,826.53 8,158.12 7,404.58 8,009.78 9,897.38 8,784.01 OSF 6/28/2011 Object code report 10 efficiency study 7 COUNTY BOARDS OF EDUCATION EXPENDITURES BY OBJECT OF EXPENDITURE GENERAL CURRENT EXPENSE FUND ON A PER PUPIL BASIS FOR THE 2009-10 YEAR Expenditures Salaries: Professional personnel Service personnel Professional substitutes Service substitutes Temporary part time professional Temporary part time service Board members Students Wayne Webster Wetzel Wirt Wood Wyoming State 3,298.06 964.69 93.11 91.79 1.23 2.31 - 3,063.23 917.06 106.93 41.25 12.26 - 3,919.28 1,149.58 174.32 53.27 7.97 - 3,285.61 1,049.93 124.97 48.33 18.37 0.51 3,416.74 1,061.28 150.58 65.98 115.05 55.21 2.32 4.18 3,670.12 1,052.48 159.63 74.43 6.19 - 3,463.30 1,078.66 142.04 66.15 11.81 11.21 5.18 0.71 4,451.19 4,140.72 5,304.42 4,527.71 4,871.33 4,962.85 4,779.07 1,779.13 350.87 425.77 0.36 2.83 52.24 - 1,727.87 326.46 440.87 5.09 95.59 - 1,942.69 413.96 594.00 1.74 49.78 - 1,955.75 352.82 440.86 11.47 48.79 - 1,610.18 385.52 514.58 6.66 2.76 73.16 19.51 818.37 373.21 628.26 4.03 38.50 - 1,709.38 375.48 494.25 0.70 3.24 60.56 6.05 Total employee benefits 2,611.20 2,595.88 3,002.17 2,809.69 2,612.37 1,862.37 2,649.67 Total salaries and employee benefits 7,062.39 6,736.59 8,306.59 7,337.40 7,483.71 6,825.23 7,428.74 Purchased professional & technical services: Administration Professional educators Employee training and development Other professional Technical Total purchased prof.& technical serv. 172.51 0.62 52.70 225.83 0.13 7.08 78.49 85.71 5.79 0.05 208.26 26.13 240.24 62.64 62.64 76.17 15.83 30.89 3.02 125.92 6.21 135.55 26.42 168.18 3.40 39.68 6.42 88.25 10.41 148.17 Purchased services-other: Utilities Cleaning Repair & maintenance Rentals Construction services Student transportation services Insurance Communications Advertising Printing/binding Tuition Food services management Travel Interagency purchased services 27.14 18.50 190.75 3.60 62.83 41.82 1.33 14.09 - 24.01 4.40 8.51 1.84 2.81 42.64 67.22 54.74 2.59 7.50 - 30.53 21.60 133.51 11.78 33.99 1.01 88.80 54.17 1.85 16.04 - 36.26 10.46 29.13 1.32 0.24 49.76 61.18 2.70 15.54 - 17.26 27.25 68.48 1.44 9.55 40.76 37.59 0.41 1.99 4.40 0.65 9.13 - 28.59 46.86 225.20 0.36 69.69 17.56 12.66 20.07 - 25.47 22.68 96.06 14.28 37.91 9.13 60.13 40.33 2.27 1.35 6.92 0.05 14.57 9.86 360.05 216.26 393.27 206.58 218.90 420.99 341.01 142.18 184.43 16.25 0.58 119.37 92.57 267.38 0.64 20.67 174.79 202.80 0.05 168.63 - 154.17 225.75 20.49 61.52 14.20 182.63 205.00 10.53 54.23 10.13 173.13 205.75 2.03 96.66 14.58 - 186.23 213.92 0.41 50.15 80.02 17.62 630.20 530.79 753.45 581.13 549.02 661.56 668.36 0.66 24.44 0.35 35.35 16.47 20.00 - 4.13 - 3.96 - 50.81 2.31 7.31 5.08 20.69 2.93 25.45 51.82 20.00 4.13 3.96 53.12 36.02 4.29 16.09 0.05 308.79 15.49 4.21 139.87 2.18 0.79 214.79 1.62 0.19 0.44 51.71 6.08 49.40 204.01 0.19 6.95 61.74 289.39 4.05 2.08 16.636.27 400.88429.92 Total salaries Employee benefits: Group insurance Social security Retirement Tuition reimbursement Unemployment compensation Workers' compensation Other employee benefits Total purchased services-other Supplies: General Energy Food Books, periodicals and software Technology supplies Vehicle supplies Total supplies Plant and equipment: Land Buildings Equipment Bus replacement Total plant and equipment Other: Dues and fees Judgements Debt related Taxes Student Assistance Miscellaneous Transfers Out Total other Total expenditures 329.22 159.57 217.75 53.95 259.49 358.27 429.92 8,633.15 7,780.75 9,931.30 8,245.84 8,640.99 8,487.35 9,052.21 OSF 6/28/2011 Object code report 10 efficiency study 8
