Document 11006964
advertisement
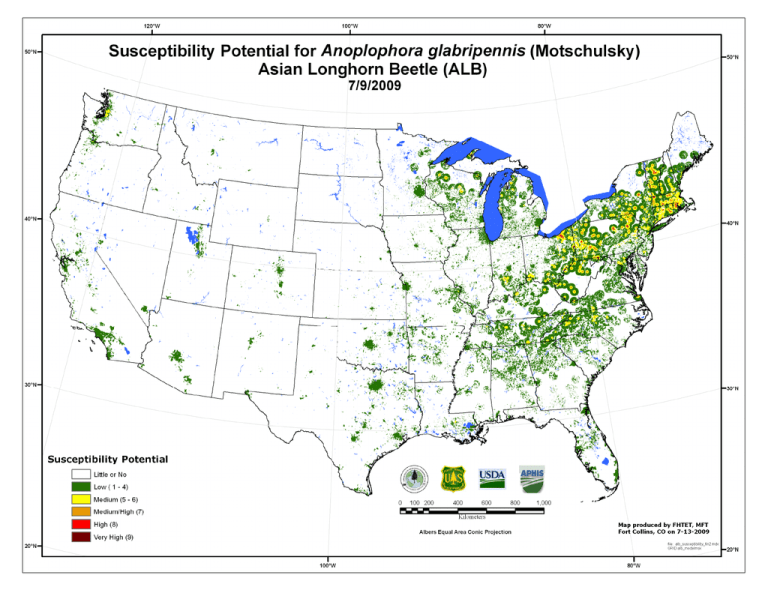
Summary of Susceptibility Potential for Anoplophora glabripennis (Motschulsky): Asian Longhorn Beetle (ALB) July 9, 2009 Website URL: http://www.fs.fed.us/foresthealth/technology/invasives_anoplophoraglabripennis_riskmaps.shtml The Susceptibility Potential Surface for Anoplophora glabripennis (Motschulsky), the Asian Longhorn Beetle (ALB), was produced for the Conterminous United States (CUS) in 1 square kilometer (km2) units by the U.S. Forest Service, Forest Health Technology Enterprise Team’s (FHTET) Invasive Species Steering Committee (Table 1). The product’s intended use is to develop a detection strategy for Anoplophora glabripennis that focuses efforts in areas where there is susceptible maple host species which occur in forested habitat. The Susceptibility Surface was produced by combining the Anoplophora glabripennis Introduction and Establishment Potential surfaces in a weighted overlay. The arithmetic weights used were: 30 % for the Introduction surface and 70 % for the Establishment surface (Table 2). Table 3 shows that 168,831,816 acres of forest are vulnerable to attack from Anoplophora glabripennis. Introduction Associated Commodities Source Data: The APHIS Pest Interception Network (PIN) Dataset was used to determine which commodities are associated with Anoplophora glabripennis interceptions. Associated commodities include bricks, metal, glass and machinery. Although machinery was identified in the APHIS PIN dataset, it was not included in our analysis because it was not a discriminatory factor; machinery was found in all ZIP codes. Light Industry Businesses: Polygon ZIP code centroids were selected to represent the locations of Light Industry Businesses that handle the commodities of interest from the APHIS PIN dataset. The assumption was that these Light Industry Businesses import some amount of these commodities including bricks, stone, metal, and glass. Total number of employees (i.e. 2 to 1,769) were attributed to each centroid location and partitioned into 10 equal area classes. Based on their assigned class, centeroids were assigned a rank from 1 to 10 with 10 representing the highest potential and highest number of employees. Each centroid was buffered 30km and divided into a set of concentric zones depending on the centroid rank. For example, a buffer around a centroid with a rank of 9 was broken into 9 zones which were assigned values ranging from 9 (inner zone) to 1 (outer zone). Once the zones were ranked for every centroid they were overlayed using a maximum function to ensure that higher ranked areas predominated. All regions outside of the 30km buffer were assigned a rank of zero. Source U.S. Census Bureau, North American Industry Classification System (NAICS), Business and Industry, County Business complete ZIP Code totals for the 1998 Dataset. http://www.census.gov/eos/www/naics/ Establishment The Establishment Surface was produced using the Basal Area for all maple (Acer spp.). Host Basal Area: Mean Basal Area (BA) for all maple (Acer spp.) were calculated and assigned to each of the ZIP code centroids created in the Introduction component. Centroids, with Mean BA values ranging from 0 to 39, were then ranked using 10 equal area classes, buffered, and broken into zones. Regions beyond 30 km of centroids were assigned a value of zero. Source: The 1km Maple Basal Area surface was derived from US Forest Service Forest Inventory and Analysis (FIA) data. The 30 km buffers were used to include the cumulative distances that ALB could possibly disperse over a 15 year period at 2 km per year (Bancroft et al. 2001). References Bancroft, J.S. and M.T. Smith. 2001. Modeling dispersal of the Asian longhorn beetle. In USDA Interagency Research Forum Proceedings. Table 1 Steering Committee Members Marla C. Downing, FHTET Frank H. Koch, USFS SRS Frank J. Krist Jr., USFS FHTET Frank J. Sapio, USFS FHTET Bill D. Smith, USFS SRS Table 2 Susceptibility Weights Introduction 30% Potential Establishment 70% Potential Table 3 Summary of Susceptibility for ALB Susceptibility Acres Percent Low 145,291,341 86.06 Medium 19,588,111 11.60 Medium/High 3,505,114 2.08 High 404,256 0.24 Very High 42,995 0.03 Total 168,831,816 100.00 Little or No 1,756,058,404
