2004 University of California Undergraduate Experience Survey News & Information Sources 16.
advertisement

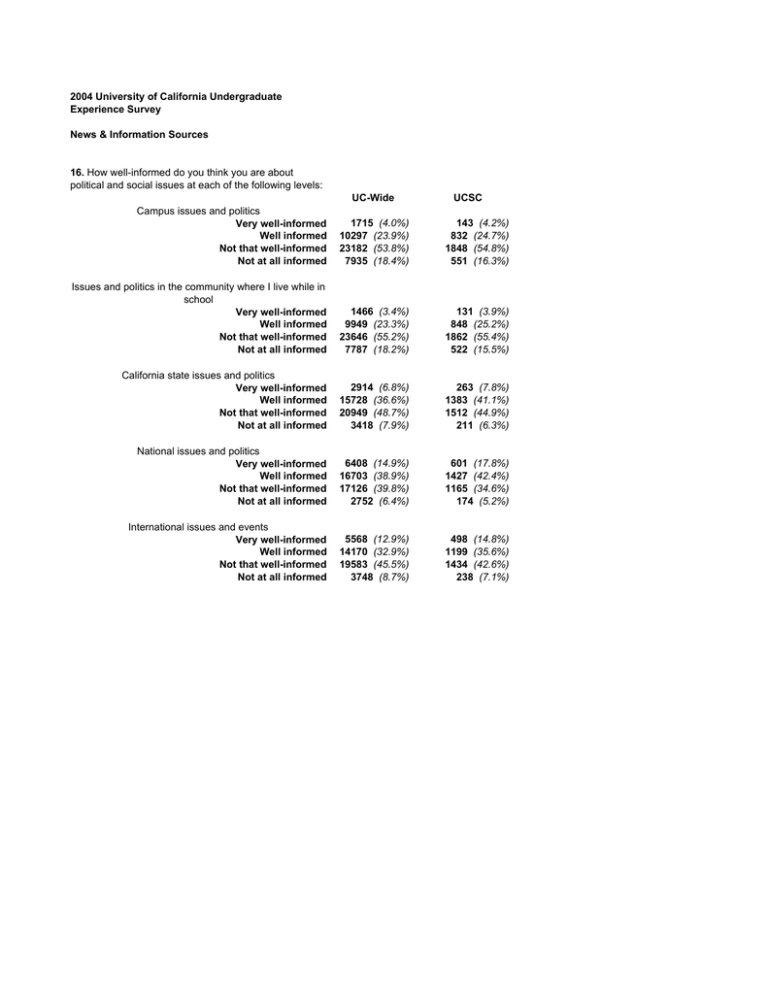
2004 University of California Undergraduate Experience Survey News & Information Sources 16. How well-informed do you think you are about political and social issues at each of the following levels: UC-Wide UCSC Campus issues and politics Very well-informed Well informed Not that well-informed Not at all informed 1715 (4.0%) 10297 (23.9%) 23182 (53.8%) 7935 (18.4%) 143 (4.2%) 832 (24.7%) 1848 (54.8%) 551 (16.3%) Issues and politics in the community where I live while in school Very well-informed Well informed Not that well-informed Not at all informed 1466 (3.4%) 9949 (23.3%) 23646 (55.2%) 7787 (18.2%) 131 (3.9%) 848 (25.2%) 1862 (55.4%) 522 (15.5%) California state issues and politics Very well-informed Well informed Not that well-informed Not at all informed 2914 (6.8%) 15728 (36.6%) 20949 (48.7%) 3418 (7.9%) 263 (7.8%) 1383 (41.1%) 1512 (44.9%) 211 (6.3%) National issues and politics Very well-informed Well informed Not that well-informed Not at all informed 6408 (14.9%) 16703 (38.9%) 17126 (39.8%) 2752 (6.4%) 601 (17.8%) 1427 (42.4%) 1165 (34.6%) 174 (5.2%) International issues and events Very well-informed Well informed Not that well-informed Not at all informed 5568 (12.9%) 14170 (32.9%) 19583 (45.5%) 3748 (8.7%) 498 (14.8%) 1199 (35.6%) 1434 (42.6%) 238 (7.1%) 17. Please indicate how often you use the following sources of news information: UC-Wide UCSC National television news Everyday Several times a week Once a week Less than once a week Never 3960 (9.2%) 9143 (21.2%) 8075 (18.7%) 12217 (28.3%) 9722 (22.5%) 236 (7.0%) 641 (19.0%) 514 (15.2%) 953 (28.2%) 1033 (30.6%) 3412 (8.0%) 9581 (22.4%) 7839 (18.3%) 11587 (27.0%) 10429 (24.3%) 157 (4.7%) 544 (16.2%) 496 (14.8%) 945 (28.2%) 1213 (36.2%) 2759 (6.5%) 7553 (17.7%) 6550 (15.3%) 11742 (27.5%) 14136 (33.1%) 126 (3.8%) 425 (12.7%) 426 (12.7%) 934 (27.9%) 1433 (42.9%) 3551 (8.3%) 6797 (15.8%) 4926 (11.5%) 10199 (23.7%) 17478 (40.7%) 244 (7.2%) 480 (14.3%) 414 (12.3%) 820 (24.4%) 1408 (41.8%) 1660 (3.9%) 3738 (8.7%) 4016 (9.4%) 9801 (22.9%) 23625 (55.1%) 106 (3.2%) 228 (6.8%) 295 (8.8%) 732 (21.9%) 1987 (59.3%) 923 (2.2%) 3824 (8.9%) 8129 (19.0%) 13075 (30.6%) 16812 (39.3%) 56 (1.7%) 262 (7.8%) 566 (16.9%) 1012 (30.1%) 1463 (43.6%) 5759 11357 9828 10181 5946 (13.4%) (26.4%) (22.8%) (23.6%) (13.8%) 33 (1.0%) 227 (6.7%) 673 (20.0%) 1248 (37.0%) 1190 (35.3%) 3124 (7.3%) 6249 (14.6%) 6910 (16.2%) 12373 (29.0%) 14048 (32.9%) 239 (7.2%) 557 (16.7%) 574 (17.2%) 995 (29.8%) 975 (29.2%) 13681 (31.8%) 12235 (28.4%) 6431 (14.9%) 6549 (15.2%) 4135 (9.6%) 1041 (30.9%) 983 (29.2%) 491 (14.6%) 550 (16.3%) 301 (8.9%) Local television news Everyday Several times a week Once a week Less than once a week Never Public television Everyday Several times a week Once a week Less than once a week Never Public Radio Everyday Several times a week Once a week Less than once a week Never Talk radio Everyday Several times a week Once a week Less than once a week Never Weekly news magazines Everyday Several times a week Once a week Less than once a week Never Campus newspaper Everyday Several times a week Once a week Less than once a week Never Other daily newspaper Everyday Several times a week Once a week Less than once a week Never Internet (including online newspapers) Everyday Several times a week Once a week Less than once a week Never


