Predicting stress-induced anisotropy around a borehole
advertisement
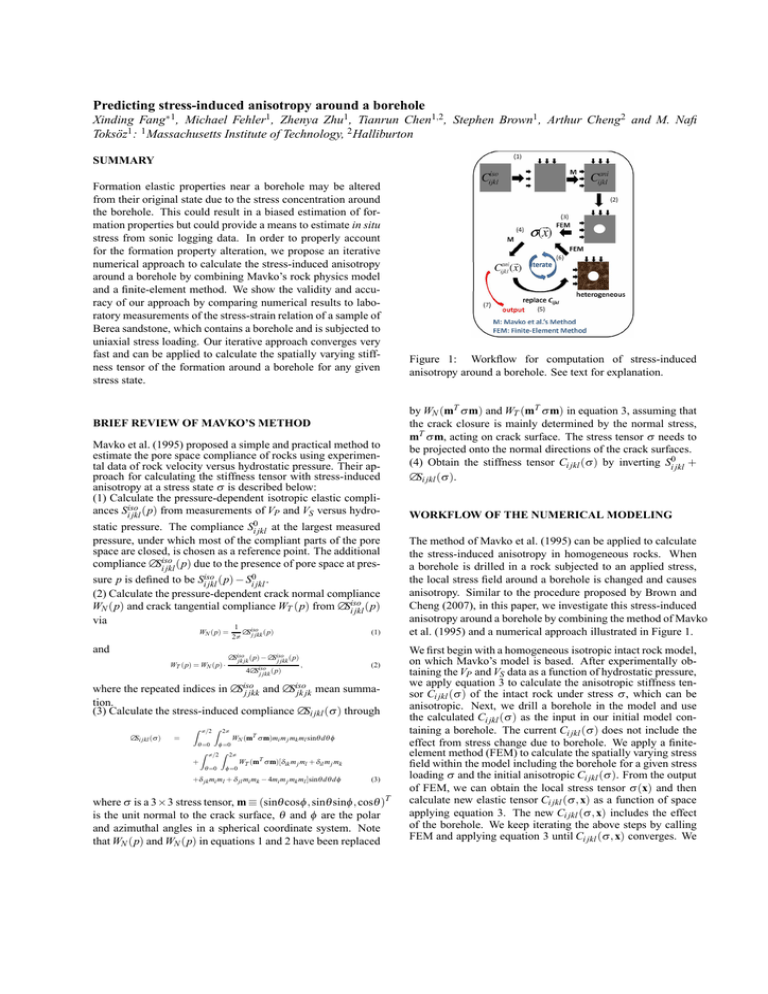
Predicting stress-induced anisotropy around a borehole Xinding Fang∗1 , Michael Fehler1 , Zhenya Zhu1 , Tianrun Chen1,2, Stephen Brown1 , Arthur Cheng2 and M. Nafi Toksöz1 : 1 Massachusetts Institute of Technology, 2 Halliburton SUMMARY Formation elastic properties near a borehole may be altered from their original state due to the stress concentration around the borehole. This could result in a biased estimation of formation properties but could provide a means to estimate in situ stress from sonic logging data. In order to properly account for the formation property alteration, we propose an iterative numerical approach to calculate the stress-induced anisotropy around a borehole by combining Mavko’s rock physics model and a finite-element method. We show the validity and accuracy of our approach by comparing numerical results to laboratory measurements of the stress-strain relation of a sample of Berea sandstone, which contains a borehole and is subjected to uniaxial stress loading. Our iterative approach converges very fast and can be applied to calculate the spatially varying stiffness tensor of the formation around a borehole for any given stress state. BRIEF REVIEW OF MAVKO’S METHOD Mavko et al. (1995) proposed a simple and practical method to estimate the pore space compliance of rocks using experimental data of rock velocity versus hydrostatic pressure. Their approach for calculating the stiffness tensor with stress-induced anisotropy at a stress state σ is described below: (1) Calculate the pressure-dependent isotropic elastic compliances Siiso jkl (p) from measurements of VP and VS versus hydrostatic pressure. The compliance Si0jkl at the largest measured pressure, under which most of the compliant parts of the pore space are closed, is chosen as a reference point. The additional compliance ∆Siiso jkl (p) due to the presence of pore space at pres0 sure p is defined to be Siiso jkl (p) − Si jkl . (2) Calculate the pressure-dependent crack normal compliance WN (p) and crack tangential compliance WT (p) from ∆Siiso jkl (p) via 1 ∆Siso (p) 2π j jkk WN (p) = and WT (p) = WN (p) · iso ∆Siso jk jk (p) − ∆S j jkk (p) 4∆Siso (p) j jkk (1) , (2) ∆Siso j jkk where the repeated indices in and ∆Siso jk jk mean summation. (3) Calculate the stress-induced compliance ∆Si jkl (σ ) through ∆Si jkl (σ ) = Z π /2 Z 2π θ =0 + φ =0 WN (mT σ m)mi m j mk ml sinθ d θ φ Z π /2 Z 2π θ =0 φ =0 WT (mT σ m)[δik m j ml + δil m j mk +δ jk mi ml + δ jl mi mk − 4mi m j mk ml ]sinθ d θ d φ (3) where σ is a 3×3 stress tensor, m ≡ (sinθ cosφ , sinθ sinφ , cosθ )T is the unit normal to the crack surface, θ and φ are the polar and azimuthal angles in a spherical coordinate system. Note that WN (p) and WN (p) in equations 1 and 2 have been replaced Figure 1: Workflow for computation of stress-induced anisotropy around a borehole. See text for explanation. by WN (mT σ m) and WT (mT σ m) in equation 3, assuming that the crack closure is mainly determined by the normal stress, mT σ m, acting on crack surface. The stress tensor σ needs to be projected onto the normal directions of the crack surfaces. (4) Obtain the stiffness tensor Ci jkl (σ ) by inverting Si0jkl + ∆Si jkl (σ ). WORKFLOW OF THE NUMERICAL MODELING The method of Mavko et al. (1995) can be applied to calculate the stress-induced anisotropy in homogeneous rocks. When a borehole is drilled in a rock subjected to an applied stress, the local stress field around a borehole is changed and causes anisotropy. Similar to the procedure proposed by Brown and Cheng (2007), in this paper, we investigate this stress-induced anisotropy around a borehole by combining the method of Mavko et al. (1995) and a numerical approach illustrated in Figure 1. We first begin with a homogeneous isotropic intact rock model, on which Mavko’s model is based. After experimentally obtaining the VP and VS data as a function of hydrostatic pressure, we apply equation 3 to calculate the anisotropic stiffness tensor Ci jkl (σ ) of the intact rock under stress σ , which can be anisotropic. Next, we drill a borehole in the model and use the calculated Ci jkl (σ ) as the input in our initial model containing a borehole. The current Ci jkl (σ ) does not include the effect from stress change due to borehole. We apply a finiteelement method (FEM) to calculate the spatially varying stress field within the model including the borehole for a given stress loading σ and the initial anisotropic Ci jkl (σ ). From the output of FEM, we can obtain the local stress tensor σ (x) and then calculate new elastic tensor Ci jkl (σ , x) as a function of space applying equation 3. The new Ci jkl (σ , x) includes the effect of the borehole. We keep iterating the above steps by calling FEM and applying equation 3 until Ci jkl (σ , x) converges. We Borehole stress-induced anisotropy use the following as a convergence criterion v i2 uP h m−1 m N u i jkl Ci jkl (xn ) − Ci jkl (xn ) 1 Xu u Convergence(m) = i2 t P h m−1 N n=1 i jkl Ci jkl (xn ) (4) where m indicates the mth iteration, P N is the total number of spatial sampling points of the model, i jkl means the summation over 21 independent elastic constants, Convergence(m) indicates the percentage change of the model stiffness after the mth iteration comparing to the model at the (m − 1)th iteration. We define Ci jkl to have converged when Convergence(m) < 1%. Convergence means that Ci jkl and the stress are consistent and Hooke’s law is satisfied. Finally, we can obtain the spatial distribution of the anisotropic elastic constants Ci jkl (σ , x) around a borehole for the given stress state as the output of our numerical model. In our approach, we assume that stress induced anisotropy is caused by the closure of cracks due to the applied compressive stress on crack surfaces and the effect of tensile stress is negligible. This assumption brings out two issues: (1) how important is the tensile stress in the earth? (2) how do we deal with the tensile stress in our calculation? We will discuss these in the following. For a homogeneous isotropic elastic rock, the circumferential stress σθ and the radial stress σr around a circular borehole subjected to minimum and maximum principal stresses (Sh and SH ) are given by (for example, Tang and Cheng (2004)) σθ = σr = 1 (S + Sh ) 2 H 1 (S + Sh ) 2 H R2 1+ 2 r R2 1− 2 r ! ! + − 1 (S − Sh ) 2 H 1 (S − Sh ) 2 H R4 1+3 4 r ! cos2θ R4 R2 1−4 2 +3 4 r r ! cos2θ (5) (6) where R is borehole radius, r is the distance from the center of borehole, θ is azimuth measured from the direction of SH . The compressive stress σθ + σr around the borehole provides an indication on how velocity around the borehole is affected by stress concentration. σθ + σr has maximum and minimum values at the wellbore, and σr =0 at r=R, so the stress field at the wellbore is dominated by σθ , which has the maximum value σθ = 3SH − Sh at θ = ±900 and the minimum value σθ = 3Sh − SH at θ = 00 and 1800 . In situ, both SH and Sh are present, and SH ≤ 3Sh in most case (Zoback et al., 1985; Brace and Kohlstedt, 1980), thus the minimum σθ = 3Sh − SH ≥ 0 is compressive. In this sense, there is no tensile stress around the borehole. However, the condition SH ≤ 3Sh may not be satisfied in the laboratory experiments. Uniaxial compression experiments (i.e. Sh =0), which would induce significant tensile stress around the borehole, have been conducted for the study of stress induced velocity change around a borehole by many researchers (Winkler, 1996; Winkler et al., 1998; Tang and Cheng, 2004). The change of rock elastic properties caused by tensile stress is usually unknown. Traditional methods (Sinha and Kostek, 1996; Tang et al., 1999) for calculating the stress dependent velocity around a borehole use the data measured from compression experiments to estimate either the third order elastic constants or empirical coefficients, which relate the rock velocity change to the applied stresses. For the case of uniaxial stress, they based their equations on compression experiment data to predict the velocity in the tensile stress regions, this kind of extrapolation has no physical basis and could result in underestimation of the velocity in the regions around θ = 00 and 1800 . Different kinds of rock would respond to tensile stress differently due to varying microcrack structure and rock strength. For Berea sandstone, which is used in our experiments, tensile stresses are relatively less efficient in opening microcracks (Winkler, 1996), we assume the rock elastic constants under tensile stress remain the same as in a zero stress state in our calculation. Our results will show that good results can be obtained with this assumption on Berea sandstone. LABORATORY EXPERIMENT In this section, we present results from static strain measurement on a Berea sandstone sample under uniaxial loading to verify the validity and reliability of our numerical approach. The dimension of the Berea sandstone sample used in this experiment is 10×10×10 cm. We measured the P- and S-wave velocities of the unstressed rock sample in three directions and find that P-wave and S-wave anisotropy are only 0.7% and 1.8%, respectively. Density of the rock is 2.198 g/cm3 and porosity is 17.7%. First, we measure P- and S-wave velocities under varying hydrostatic stress. These data are used to estimate the normal and tangential crack compliances as functions of hydrostatic pressure, which are required by the method of Mavko et al. (1995). Then, we measure the strain-stress behavior of the rock containing a borehole subjected to a gradually increasing uniaxial stress and compare it with our numerical calculations. Measurement of P- and S-wave velocities under hydrostatic compression In order to measure P- and S-wave velocities versus hydrostatic pressure, we cut a 2 inch long and 1 inch diameter cylindrical core from our rock sample that will also be used for the subsequent experiments. We measured P- and S-wave velocities along the core axis direction. The S-wave velocity measurements were made using two orthogonal polarization directions, as shown in Figure 2. We use the following empirical equation to fit the velocity data V= ( a1 · P + b1 , P ≤ 1 MPa a2 · logP + b2 , P > 1 MPa (7) where V represents both P- and S velocities and P is hydrostatic pressure, a1 , b1 , a2 and b2 are constants to be determined through least-squares method by adding the constraint that the two fitting functions are equal at P=1 MPa. The fits to the Pand S-wave (average of S1 and S2 ) velocities are shown as the blue and red curves, respectively, in Figure 2. Given equation 7, we can now analytically calculate the P and S-velocity at any given hydrostatic pressure. Strain measurement of the rock with a borehole under uniaxial loading A borehole with 14.2 mm radius was drilled through the rock along the X-axis, as shown in Figure 3. Uniaxial stress, which is applied along Z-axis, is perpendicular to the borehole axis. The stress is raised from 0 to 10.6 MPa in steps of 0.96 MPa. Strain measurements are made at four locations represented Borehole stress-induced anisotropy −1 4000 P S 3600 3200 Convergence Velocity (m/s) 1 S 2 2800 2400 0.96 MPa 10 −2 10 −3 10 −4 10 −5 10 1.92 MPa 2.88 MPa 3.85 MPa 4.81 MPa 5.77 MPa 6.73 MPa −10 10 7.69 MPa 8.65 MPa 9.61 MPa 2000 10.6 MPa −15 20 30 Stress (MPa) 40 50 Figure 2: Measurements of VP (squres) and VS (triangles and circles) of the Berea sandstone core sample under hydrostatic compression. Shear wave velocities S1 and S2 were measured along the same propagation direction but with orthogonal polarization directions. Blue and red curves are the fitting curves (equation 7) to the VP and VS (average of S1 and S2 ) respectively. The root-mean-square misfits are, respectively, 38 m/s and 18 m/s for the fits to P- and S-wave velocities. 1 2 3 4 5 6 7 Number of iteration 8 9 10 Figure 4: Convergence (equation 4) of the iteration scheme. (A) (B) 0.2 0.2 0 0 −0.2 −0.2 −3 10 Strain (10 ) 1600 0 10 −0.4 e ⊥ −0.4 e ⊥ −0.6 e || −0.6 e || −0.8 0 2 4 6 8 10 2 4 6 8 10 4 6 8 Stress (MPa) 10 (D) 0.2 0.2 0 0 −3 Strain (10 ) (C) −0.8 0 −0.2 e ⊥ −0.4 e ⊥ −0.6 e || −0.6 e || −0.8 0 Figure 3: Schematic showing uniaxial stress loading of a rock with a borehole. Strain measurements are made at locations A, B, C and D. B and C are 2 cm away from the borehole center, A and D are 3 cm away from the borehole center. by A, B, C and D, as shown in Figure 3. We applied our work flow illustrated in Figure 1 and used a FEM software to numerically calculate the stress-induced anisotropy around the borehole subjected to uniaxial stress. Figure 4 shows the convergence (equation 4) of the iterations at eleven loading stresses. We found that the convergence is very fast and the change of model stiffness is less than 1% after the first two iterations. We will show the results obtained after the fifth iteration. Figure 5 shows the comparison between the strains (black solid curves) calculated using our approach (Figure 1) and the measured strains (solid and empty squares) at positions A, B, C and D. The dashed curves, which are shown for comparison, are the strain values calculated under the assumption that rock properties remain isotropic during the experiment but using the VP and VS given by equation 7 in different stress state. The absolute values of these dashed curves are always smaller than those of the solid curves. For the isotropic case, the normal stress causes the closure of all cracks inde- −0.2 −0.4 2 4 6 8 Stress (MPa) 10 −0.8 0 2 Figure 5: Comparison of lab measured strains and numerical results at locations A, B, C and D, which are shown in Figure 3. Solid and open squares are the measured strains in the directions parallel and normal to the loading stress respectively. Error bars represent estimates of errors from uncertainty in the measurement of loading stress (∼ 5%) and the error of the gage factor (∼ 1%). Solid curves and dashed curves are the predicted values obtained from the anisotropic model and isotropic model, respectively. pendent of orientation, while the anisotropic model assumes smaller closure of cracks oriented in directions not perpendicular to the loading direction. We find a good match between the lab measurements and the black solid curves. Strains measured at B and C are strongly affected by the stress alteration around the borehole. The strain e|| at B in absolute value is much larger than those at A, C and D, and it reaches a minimum value at C. This is because stress is highly concentrated at B and released at C. The strain e|| at D is smaller than that at A. This is again due to the alteration of stress concentration around borehole. The strain e⊥ always seems to be underestimated in our approach perhaps due to the neglect of crack opening. Our numerical results, however, are a very reasonable match with the measurements. Winkler (1996) measured the VP versus azimuth around a borehole in Berea sandstone with applied uniaxial stress. In his experiment, a block of Berea sandstone (15×15×13 cm) with Borehole stress-induced anisotropy along borehole axis direction is given as VP = density. C1111 ρ , ρ is For a wave with wavelength λ̃ , the penetration depth of the waves propagating along the wellbore could be up to 1∼2 λ̃ . We first calculate VP from C1111 and then average VP at each azimuth to obtain the velocity variation with azimuth. The velocity averaging method is shown in Figure 6. In Figure 6, the black circle represents a circular area centered at the wellbore at θ = 00 with radius r, which represents the penetration depth of the waves, VP at θ = 00 is taken as the average of VP inside the black circle. By moving this black circle from θ = 00 to 3600 , a scan of VP versus azimuth can be obtained. We choose r = λ̃ , 1.5λ̃ and 2λ̃ to do the averaging separately over different areas, which are shown as the red, blue and magenta circles in Figure 6, respectively. The predicted average velocities normalized by the VP with no applied stress are plotted in Figure 7 together with the data measured by Winkler (1996) (black dots). Winkler (1996) used a cos(2θ ) function, shown as the black curve in Figure 7, to fit the data based on the cos(2θ ) dependence of σθ and σr on θ in equations 5 and 6. Winkler (1996) also showed that we can use an exponential function to fit the data, but we only show the consine fit here. Red, blue and magenta curves are the velocities obtained from our model by using different averaging radii r. The azimuthal velocity variation decreases away from the wellbore, so a larger averaging radius r gives smaller velocity variation. r = 1.5λ̃ could be a reasonable averaging radius. The mismatch between the blue curve and the black best fit curve is larger at θ =00 and 1800 , this may be caused by the neglect of crack opening in our calculation. C1111 GPa 10 24 Z (cm) r 22 5 20 0 18 0 5 Y (cm) 10 Figure 6: C1111 in the Y-Z profile under 10 MPa uniaxial stress loading in Z direction. Circles show how the VP is calculated through averaging over a region. Black circle represents a circular region centering at the wellbore at θ =00 with radius r. Red, blue and magenta dashed circles indicate the averaging regions for r=λ̃ , 1.5λ̃ and 2λ̃ , respectively. 1.2 1.15 Normalized velocity a 2.86 cm diameter borehole was saturated in a water tank for conducting acoustic measurements. VP at each azimuth was measured along the borehole axis by using directional transducers. Vp of their rock sample in an unstressed state is 2.54 km/s and porosity is 22%. The center frequency of their recorded acoustic signals is about 250 kHz, the corresponding wave length is 1.02 cm, which is equal to 0.36D (D: borehole diameter). We define λ̃ = 0.36D as the characteristic wavelength for measuring VP . The size of the rock sample and borehole in our experiment is different, therefore we compare our results through scaling the model by the borehole diameter. We calculate the spatial distribution of the stiffness tensor of our Berea sandstone borehole model with 10 MPa uniaxial stress applied. The velocity of a P-wave propagating along the borehole axis is mainly governed by the elastic constant C1111 , which is shown in Figure 6. Figure 6 shows that the rock becomes stiffer around the regions at θ = ±900 , while it is relatively softer at θ = 00 and 1800 . Assuming that VP along X-axis direction is mainly governed by C1111 q , then VP 1.1 data best fit 1.05 r = λ̃ 1 r = 1.5λ̃ r = 2λ̃ 0.95 0 90 180 Azimuth (degree) 270 360 Figure 7: Solid circles are the normalized VP (normalized by the velocity measured at 0 stress state) measured by Winkler (1996) under 10 MPa uniaxial stress. Black curve is the best fit to the data. Red, blue and magenta curves show the normalized velocities of the Berea sandstone used in our experiment by using r=λ̃ , 1.5λ̃ and 2λ̃ , respectively, in the averaging. around a borehole. The accuracy of our method is validated through laboratory experiments on a Berea Sandstone sample. Our approach can predict the stress-strain relation around a borehole in Berea sandstone under uniaxial stress reasonably well. Our method can be applied to calculate the spatially varying anisotropic elastic constants which are required for the forward modeling of wave propagation in a borehole under a given stress state. Also, this could potentially provide a physical basis for using acoustic cross-dipole logging to estimate the in situ stress state. CONCLUSIONS In this paper, we present a numerical approach to predict the stress-induced anisotropy around a borehole given a stress state by applying the method of Mavko et al. (1995). Our method uses hydrostatic data (i.e. VP and VS ), which are easy to obtain, to calculate the distribution of this stress-induced anisotropy ACKNOWLEDGMENTS We thank Dan Burns for helpful discussion. Tianrun Chen was supported by an ERL Founding Member postdoctoral fellowship. Borehole stress-induced anisotropy REFERENCES Brace, W., and D. Kohlstedt, 1980, Limits on lithospheric stress imposed by laboratory experiments: Journal of Geophysical Research, 85, 6248–6252. Brown, S., and A. Cheng, 2007, Velocity anisotropy and heterogeneity around a borehole: SEG Technical Program Expanded Abstracts, 26, 318–322. Mavko, G., T. Mukerji, and N. Godfrey, 1995, Predicting stress-induced velocity anisotropy in rocks: Geophysics, 60, 1081. Sinha, B., and S. Kostek, 1996, Stress-induced azimuthal anisotropy in borehole flexural waves: Geophysics, 61, 1899. Tang, X., and C. Cheng, 2004, Quantitative borehole acoustic methods: Pergamon. Tang, X., N. Cheng, and A. Cheng, 1999, Identifying and estimating formation stress from borehole monopole and crossdipole acoustic measurement: SPWLA 40th. Winkler, K., 1996, Azimuthal velocity variations caused by borehole stress concentrations: Journal of geophysical research, 101, 8615–8621. Winkler, K., B. Sinha, and T. Plona, 1998, Effects of borehole stress concentrations on dipole anisotropy measurements: Geophysics, 63, 11. Zoback, M., D. Moos, L. Mastin, and R. Anderson, 1985, Well bore breakouts and in situ stress: Journal of Geophysical Research, 90, 5523–5530.


