Production of O Herzberg states in the deep UV photodissociation of ozone 2
advertisement
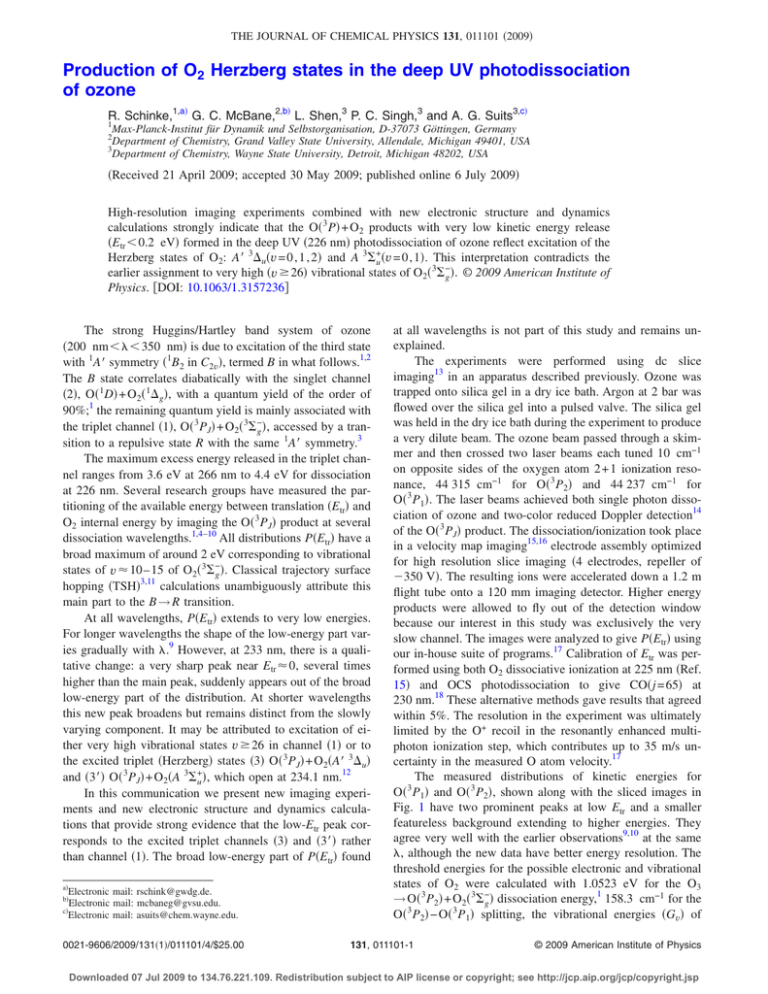
THE JOURNAL OF CHEMICAL PHYSICS 131, 011101 共2009兲 Production of O2 Herzberg states in the deep UV photodissociation of ozone R. Schinke,1,a兲 G. C. McBane,2,b兲 L. Shen,3 P. C. Singh,3 and A. G. Suits3,c兲 1 Max-Planck-Institut für Dynamik und Selbstorganisation, D-37073 Göttingen, Germany Department of Chemistry, Grand Valley State University, Allendale, Michigan 49401, USA 3 Department of Chemistry, Wayne State University, Detroit, Michigan 48202, USA 2 共Received 21 April 2009; accepted 30 May 2009; published online 6 July 2009兲 High-resolution imaging experiments combined with new electronic structure and dynamics calculations strongly indicate that the O共 3 P兲 + O2 products with very low kinetic energy release 共Etr ⬍ 0.2 eV兲 formed in the deep UV 共226 nm兲 photodissociation of ozone reflect excitation of the Herzberg states of O2: A⬘ 3⌬u共v = 0 , 1 , 2兲 and A 3⌺+u 共v = 0 , 1兲. This interpretation contradicts the earlier assignment to very high 共v ⱖ 26兲 vibrational states of O2共 3⌺−g 兲. © 2009 American Institute of Physics. 关DOI: 10.1063/1.3157236兴 The strong Huggins/Hartley band system of ozone 共200 nm⬍ ⬍ 350 nm兲 is due to excitation of the third state with 1A⬘ symmetry 共1B2 in C2v兲, termed B in what follows.1,2 The B state correlates diabatically with the singlet channel 共2兲, O共 1D兲 + O2共 1⌬g兲, with a quantum yield of the order of 90%;1 the remaining quantum yield is mainly associated with the triplet channel 共1兲, O共 3 PJ兲 + O2共 3⌺−g 兲, accessed by a transition to a repulsive state R with the same 1A⬘ symmetry.3 The maximum excess energy released in the triplet channel ranges from 3.6 eV at 266 nm to 4.4 eV for dissociation at 226 nm. Several research groups have measured the partitioning of the available energy between translation 共Etr兲 and O2 internal energy by imaging the O共 3 PJ兲 product at several dissociation wavelengths.1,4–10 All distributions P共Etr兲 have a broad maximum of around 2 eV corresponding to vibrational states of v ⬇ 10– 15 of O2共 3⌺−g 兲. Classical trajectory surface hopping 共TSH兲3,11 calculations unambiguously attribute this main part to the B → R transition. At all wavelengths, P共Etr兲 extends to very low energies. For longer wavelengths the shape of the low-energy part varies gradually with .9 However, at 233 nm, there is a qualitative change: a very sharp peak near Etr ⬇ 0, several times higher than the main peak, suddenly appears out of the broad low-energy part of the distribution. At shorter wavelengths this new peak broadens but remains distinct from the slowly varying component. It may be attributed to excitation of either very high vibrational states v ⱖ 26 in channel 共1兲 or to the excited triplet 共Herzberg兲 states 共3兲 O共 3 PJ兲 + O2共A⬘ 3⌬u兲 and 共3⬘兲 O共 3 PJ兲 + O2共A 3⌺+u 兲, which open at 234.1 nm.12 In this communication we present new imaging experiments and new electronic structure and dynamics calculations that provide strong evidence that the low-Etr peak corresponds to the excited triplet channels 共3兲 and 共3⬘兲 rather than channel 共1兲. The broad low-energy part of P共Etr兲 found a兲 Electronic mail: rschink@gwdg.de. Electronic mail: mcbaneg@gvsu.edu. c兲 Electronic mail: asuits@chem.wayne.edu. b兲 0021-9606/2009/131共1兲/011101/4/$25.00 at all wavelengths is not part of this study and remains unexplained. The experiments were performed using dc slice imaging13 in an apparatus described previously. Ozone was trapped onto silica gel in a dry ice bath. Argon at 2 bar was flowed over the silica gel into a pulsed valve. The silica gel was held in the dry ice bath during the experiment to produce a very dilute beam. The ozone beam passed through a skimmer and then crossed two laser beams each tuned 10 cm−1 on opposite sides of the oxygen atom 2 + 1 ionization resonance, 44 315 cm−1 for O共 3 P2兲 and 44 237 cm−1 for O共 3 P1兲. The laser beams achieved both single photon dissociation of ozone and two-color reduced Doppler detection14 of the O共 3 PJ兲 product. The dissociation/ionization took place in a velocity map imaging15,16 electrode assembly optimized for high resolution slice imaging 共4 electrodes, repeller of ⫺350 V兲. The resulting ions were accelerated down a 1.2 m flight tube onto a 120 mm imaging detector. Higher energy products were allowed to fly out of the detection window because our interest in this study was exclusively the very slow channel. The images were analyzed to give P共Etr兲 using our in-house suite of programs.17 Calibration of Etr was performed using both O2 dissociative ionization at 225 nm 共Ref. 15兲 and OCS photodissociation to give CO共j = 65兲 at 230 nm.18 These alternative methods gave results that agreed within 5%. The resolution in the experiment was ultimately limited by the O+ recoil in the resonantly enhanced multiphoton ionization step, which contributes up to 35 m/s uncertainty in the measured O atom velocity.17 The measured distributions of kinetic energies for O共 3 P1兲 and O共 3 P2兲, shown along with the sliced images in Fig. 1 have two prominent peaks at low Etr and a smaller featureless background extending to higher energies. They agree very well with the earlier observations9,10 at the same , although the new data have better energy resolution. The threshold energies for the possible electronic and vibrational states of O2 were calculated with 1.0523 eV for the O3 → O共 3 P2兲 + O2共 3⌺−g 兲 dissociation energy,1 158.3 cm−1 for the O共 3 P2兲 − O共 3 P1兲 splitting, the vibrational energies 共Gv兲 of 131, 011101-1 © 2009 American Institute of Physics Downloaded 07 Jul 2009 to 134.76.221.109. Redistribution subject to AIP license or copyright; see http://jcp.aip.org/jcp/copyright.jsp 011101-2 J. Chem. Phys. 131, 011101 共2009兲 Schinke et al. 1.2 0 1 (2) vA 0 (3) 3 O( 3 P) P(Etr) R2 [a 0 ] vA 3 29 27 26 vX R1 [a 0 ] 1 2 0 1 FIG. 2. Two-dimensional representation of the diabatic B-state PES for ␣ = 100°. The highest contour is E = 6 eV and ⌬E = 0.25 eV with E = 0 corresponding to the equilibrium of the ground state X. The heavy dot marks the FC point and the dotted line 共online: red兲 indicates the contour E = 5.66 eV corresponding to = 226 nm. The two thick contour lines 共E = 5.25 eV兲 emphasize the barrier between channels 共2兲 and 共3兲 and the two bent lines 共online: blue兲 represent the B / R crossing. A typical trajectory 共E = 5.66 eV兲 with small translational and large vibrational energy is displayed. 0 P(Etr) 0.0 1.2 28 P1 3 29 0.0 0.0 28 0.1 27 0.2 0.3 Etr [eV] P2 26 0.4 0.5 FIG. 1. Sliced ion images and measured distributions P共Etr兲 for O共 3 P1兲 共upper panel兲 and P共Etr兲 for O共 3 P2兲 共lower panel兲. These distributions are separately normalized. The threshold energies for the possible dissociation channels are indicated by the vertical lines: 共1兲 O共 3 P兲 + O2共 3⌺−g , vX兲 共green兲; 共3兲 O共 3 P兲 + O2共 3⌬u , vA⬘兲 共red兲; 共3⬘兲O共 3 P兲 + O2共 3⌺+u , vA兲 共blue兲. The three energies for channel 共3兲 represent the three spin states ⍀ of O2共 3⌬u兲. Jongma et al.19 for O2共 3⌺−g 兲, and the Gv values given by Slanger and Cosby12 for O2共A⬘ 3⌬u ; ⍀兲 and O2共A 3⌺+u 兲; ⍀ = 1 – 3 denotes the three spin-orbit states of O2共 3⌬u兲. The high-energy edges of the faster peaks coincide within ⬃0.01 eV with the expected thresholds for production of v = 0 and ⍀ = 3 of channel 共3兲. The edges of the slower peaks agree similarly well with the v = 1 threshold for channel 共3兲 and the v = 0 threshold of channel 共3⬘兲, which are nearly degenerate. For 3 P2, P共Etr兲 exhibits a very narrow peak very close to zero that reflects the bright spot in the center of the sliced image. It may be attributed to v = 2 and ⍀ = 3 of channel 共3兲 and/or v = 1 of channel 共3⬘兲, which are both barely open 共0.005 eV兲. No similar peak appears for O共 3 P1兲. The shapes of the observed peaks are consistent with excitation of all three spin components of 3⌬u: ⍀ = 3, 2, and 1 共in order of increasing energy兲. The population of the ⍀ states depends on both J and v. The shift of about 0.01–0.02 eV to lower energies with respect to the threshold energies is in accordance with modest rotational excitation of the O2 product. The observed peaks do not have an obvious relation to the thresholds for production of vibrationally excited O2共X 3⌺−g 兲. Understanding the path leading to excitation of the Herzberg states requires knowledge on excited electronic states of ozone and the changes in electronic structure from the Franck–Condon 共FC兲 region out to the products. Here we use a global diabatic potential energy surface 共PES兲 for the B state 共VB, Fig. 2兲,2 determined by multireference configuration interaction 共MRCI兲 calculations 共including Davidson correction兲 with the augmented correlation consistent triplezeta basis.11 The lowest five states with 1A⬘ symmetry were calculated and diabatic PESs for four states X, A, B, and R were constructed as described by Qu et al.20 Five states are sufficient for describing channels 共1兲 and 共2兲. However, more states are required in order to explain the population of the Herzberg channels 共3兲 and 共3⬘兲. We call the O–O bond coordinate that eventually breaks R1, and the bond that remains, the O2 stretching coordinate, R2. Most trajectories that start on VB near the FC region21 very quickly dissociate into the singlet channel 共2兲. About one tenth of the trajectories in the vicinity of the B / R crossing seam “hop” to the repulsive R-state PES and dissociate to the triplet channel 共1兲, yielding the highly inverted vibrational distribution of O2共 3⌺−g 兲 seen in all experiments.1 Calculations describe the main part of this distribution very well.3,11 However, the calculated P共Etr兲 for this pathway at 226 nm is practically zero below 0.8 eV. Far in the exit channel 共R1 ⲏ 4.5a0兲 VB has the shape of a double-well potential along the O2 stretching coordinate. The deeper well at R2 = 2.3a0 belongs to the singlet channel 共2兲 while the comparatively flat well around 2.8– 2.9a0 results from the excited triplet channels 共3兲 / 共3⬘兲; a low barrier separates the two wells. To elucidate the electronic structure in this region we performed MRCI calculations as described above, but including the lowest ten 1A⬘ states. Cuts along the O2 bond for two O – O2 separations R1 are depicted in Fig. 3. 关Potential cuts for additional R1 involving 12 states calcu- Downloaded 07 Jul 2009 to 134.76.221.109. Redistribution subject to AIP license or copyright; see http://jcp.aip.org/jcp/copyright.jsp 011101-3 FIG. 3. Potential cuts along the O2 stretching coordinate R2 for 共a兲 R1 = 4a0 and 共b兲 6a0 and ␣ = 100° as obtained from the CI calculations. X, A, B, and R in 共a兲 label the diabatic states most important for the uv photodissociation. The dotted line 共online: red兲 indicates the energy corresponding to = 226 nm. The extension of the Herzberg states to small R2 共smooth solid line兲 is taken from CASSCF calculations. lated at the complete active-space self-consistent field 共CASSCF兲 level are available electronically.22兴 Many of the states are nearly degenerate for R1 = 6a0 and the potential curves are those of free O2 with O either in the ground or the excited state. The two states with minima around R2 ⬇ 2.9a0 are the Herzberg states O2共A⬘ 3⌬u兲 and O2共A 3⌺+u 兲 in combination with O共 3 P兲. The calculations predict a separation of ⬇660 cm−1 in good agreement with the experimental value of 630 cm−1.12 The lowest Herzberg state c 1⌺−u correlates, in combination with O共 3 P兲, with the triplet states of ozone and therefore does not appear in Fig. 3. All potentials approach the 3O共 3 P兲 three-body breakup limit for large R2. The representation in Fig. 3共b兲 is misleading in that it suggests the possibility of transitions between the states belonging to channel 共2兲 and those representing channels 共3兲 / 共3⬘兲. However, such transitions are impossible for infinitely separated O and O2 because they would require an accompanying transition in the free atom. The “crossing” exists only because of the 3 P − 1D excitation of the oxygen atom of 1.96 eV. The degeneracies are lifted with decreasing R1 and the network of potentials becomes much more complex as illustrated for R1 = 4a0 in Fig. 3共a兲. The real crossings for infinite R1 turn into a multitude of avoided crossings. All states have the same 1A⬘ symmetry and nonadiabatic transitions between them are, in principle, allowed. The double-well behavior of VB at large O – O2 separations is due to the combination of channels 共2兲 and 共3兲 and in this sense it is an adiabatic PES. Truly diabatic PESs, which asymptotically correlate with either of the channels 共2兲, 共3兲, or 共3⬘兲, are needed for accurate dynamics calculations. However, in view of the complexity of the potential curves in Fig. 3共a兲, especially in the region around R2 = 2.8a0, the construc- J. Chem. Phys. 131, 011101 共2009兲 tion of such diabatic PESs is currently impracticable. We can therefore describe the possible path leading to the Herzberg channels only with words and calculations on the single VB surface rather than true multistate dynamics calculations. A few percent of all trajectories started near the FC point on VB with energy corresponding to 226 nm lead to products with extremely low translational energies 共⬃4% with Etr ⬍ 0.3 eV兲. All these trajectories have one feature in common: they first perform an almost perfect symmetric stretch motion on the saddle and are driven to large O–O bond lengths 共Fig. 2兲. From the first turning point they are deflected into the dissociation channel and finally perform wide-amplitude vibrational motion almost perpendicular to the dissociation path. The initial part of the trajectory is reminiscent of a classical periodic orbit.2 The average rotational energy of the trajectories with very small Etr is of the order of 0.01–0.02 eV. Because VB is an adiabatic PES, trajectories with largeamplitude vibration pass through the transition state 共TS兲 region R2 ⬇ 2.8a0 and sample both product channels. In a quantitative multistate TSH calculation, however, the highly excited transient O3 would decide at each crossing of the TS whether it stays in one channel or hops to another. The nonadiabatic couplings diminish with increasing R1, and beyond R1 ⬇ 5.5a0 or so transitions between channels 共2兲 and 共3兲 / 共3⬘兲 become unlikely and the populations are frozen. While O and O2 separate, nonadiabatic transitions to state R are also possible. They could explain part of the nearly constant background in the measured P共Etr兲 but not the distinct maxima below 0.2 eV. A quantitative evaluation of the populations of channels 共3兲 and 共3⬘兲 is beyond our current capabilities. An estimation of the populations of the spin states J = 0 – 2 and ⍀ = 1 – 3 is even more demanding and requires knowledge on the triplet and quintet states of O3 correlating with the Herzberg states. The essential step in the proposed dissociation path leading to products with very small Etr is the large-amplitude symmetric stretching in the very first moments of motion in the B state. It immediately and directly results in highly excited O2 products. Houston reported that “highly-excited fragments begin to be observed near 234.5 nm.”1 The threshold for forming O2共 3⌬u兲 is 234.1 nm. This coincidence of observed and expected thresholds, the sudden appearance of large lowenergy peaks in P共Etr兲 between 234 and 233 nm,9 and the excellent correlation between measured peak edges and predicted thresholds in the new high-resolution data of Fig. 1 provide convincing evidence for electronic rather than vibrational excitation of O2. Miller et al.5 rejected this possibility mainly on the basis of laser-induced fluorescence 共LIF兲 pump-probe experiments, which clearly detected O2共 3⌺−g 兲 in high vibrational levels, 19ⱕ v ⱕ 26. The observed vibrational distribution had a minimum at v = 22 and matched well with the observed kinetic energy distribution of O共 3 P兲 atoms. The LIF experiments were carried out in ⬃100 torr of nitrogen and most LIF data were collected at 2 s after the photolysis pulse. Although Miller et al. performed timing experiments to ensure that the observed vibrational distribution was not appre- Downloaded 07 Jul 2009 to 134.76.221.109. Redistribution subject to AIP license or copyright; see http://jcp.aip.org/jcp/copyright.jsp 011101-4 J. Chem. Phys. 131, 011101 共2009兲 Schinke et al. ciably modified by collisions with N2, those experiments were not performed with enough time resolution to eliminate the possibility of rapid electronic quenching of the O2 Herzberg states.23 The vibrational distribution with a minimum at v = 22 seen in the LIF experiments was probably the superposition of a distribution of nascent vibrationally excited O2共X 3⌺−g 兲 that decreased with increasing v, arising from the main part of channel 共1兲, and a distribution of product states from electronic quenching of the Herzberg states. Our assignment of the low-energy peaks to production of the Herzberg states suggests two obvious experimental tests. The first is a direct detection of the electronically excited O2 products in either a molecular beam or a static gas photodissociation experiment. The second is the observation of the kinetics of production of very high vibrational states in O2共X兲 after photodissociation of ozone in a bath of N2 to confirm their production by quenching of the Herzberg states. We conclude that three processes contribute to the observed distribution of O共 3 P兲 kinetic energies. The main process requires a transition from the ozone B state to the R state, yielding ground-state molecular oxygen, and produces the main peak in P共Etr兲. The second is dissociation to the O2 Herzberg states A⬘ 3⌬u and A 3⌺+u producing the sharp spikes that appear at very low kinetic energies for photolysis wavelengths ⱗ233 nm. Finally, there is a third process that yields the low, broad distribution of slow O atoms at all wavelengths. That process remains unknown and merits further experimental and theoretical investigation. The theoretical and experimental works were supported by the DFG and the NSF, respectively, under award No. CHE-0175300. R.S. and G.C.M. acknowledge the invaluable input from S. Yu. Grebenshchikov in suggesting that electronically excited O2 may be the nascent product. The authors thank A. Wodtke and P. Houston for valuable discus- sions and N. Herath for assistance with the experiment. 1 P. L. Houston, in Modern Trends in Chemical Reaction Dynamics; Experiment and Theory (Part 2), Advanced Series in Physical Chemistry Vol. 14, edited by X. Yang and K. Liu 共World Scientific, Singapore, 2004兲. 2 S. Yu. Grebenshchikov, Z.-W. Qu, H. Zhu, and R. Schinke, Phys. Chem. Chem. Phys. 9, 2044 共2007兲. 3 Z.-W. Qu, H. Zhu, S. Yu. Grebenshchikov, and R. Schinke, J. Chem. Phys. 122, 191102 共2005兲. 4 T. Kinugawa, T. Sato, T. Arikawa, Y. Matsumi, and M. Kawasaki, J. Chem. Phys. 93, 3289 共1990兲. 5 R. L. Miller, A. G. Suits, P. L. Houston, R. Toumi, J. A. Mack, and A. M. Wodtke, Science 265, 1831 共1994兲. 6 J. A. Syage, J. Phys. Chem. 99, 16530 共1995兲. 7 D. Stranges, X. Yang, J. D. Chesko, and A. G. Suits, J. Chem. Phys. 102, 6067 共1995兲. 8 K. Takahashi, N. Taniguchi, Y. Matsumi, and M. Kawasaki, Chem. Phys. 231, 171 共1998兲. 9 J. D. Geiser, S. M. Dylewski, J. A. Mueller, R. J. Wilson, R. Toumi, and P. L. Houston, J. Chem. Phys. 112, 1279 共2000兲. 10 M. Brouard, A. Goman, S. J. Horrocks, A. J. Johnsen, F. Quadrini, and W.-H. Yuen, J. Chem. Phys. 127, 144304 共2007兲. 11 R. Schinke, S. Yu. Grebenshchikov, and G. C. McBane 共unpublished兲. 12 T. G. Slanger and P. C. Cosby, J. Phys. Chem. 92, 267 共1988兲. 13 D. Townsend, M. P. Minitti, and A. G. Suits, Rev. Sci. Instrum. 74, 2530 共2003兲. 14 C. S. Huang, W. Li, M. H. Kim, and A. G. Suits, J. Chem. Phys. 125, 121101 共2006兲. 15 D. H. Parker and A. T. J. B. Eppink, J. Chem. Phys. 107, 2357 共1997兲. 16 D. W. Chandler and P. L. Houston, J. Chem. Phys. 87, 1445 共1987兲. 17 W. Li, S. D. Chambreau, S. A. Lahankar, and A. G. Suits, Rev. Sci. Instrum. 76, 063106 共2005兲. 18 B. D. Leskiw, M. H. Kim, G. E. Hall, and A. G. Suits, Rev. Sci. Instrum. 76, 104101 共2005兲. 19 R. T. Jongma, S. Shi, and A. M. Wodtke, J. Chem. Phys. 111, 2588 共1999兲. 20 Z.-W. Qu, H. Zhu, S. Yu. Grebenshchikov, and R. Schinke, J. Chem. Phys. 123, 074305 共2005兲. 21 R. Schinke, Photodissociation Dynamics 共Cambridge University Press, Cambridge, England, 1993兲. 22 See EPAPS supplementary material at http://dx.doi.org/10.1063/ 1.3157236 for additional potential cuts. 23 A. M. Wodtke, private communication 共2009兲. Downloaded 07 Jul 2009 to 134.76.221.109. Redistribution subject to AIP license or copyright; see http://jcp.aip.org/jcp/copyright.jsp


