Document 10923347
advertisement
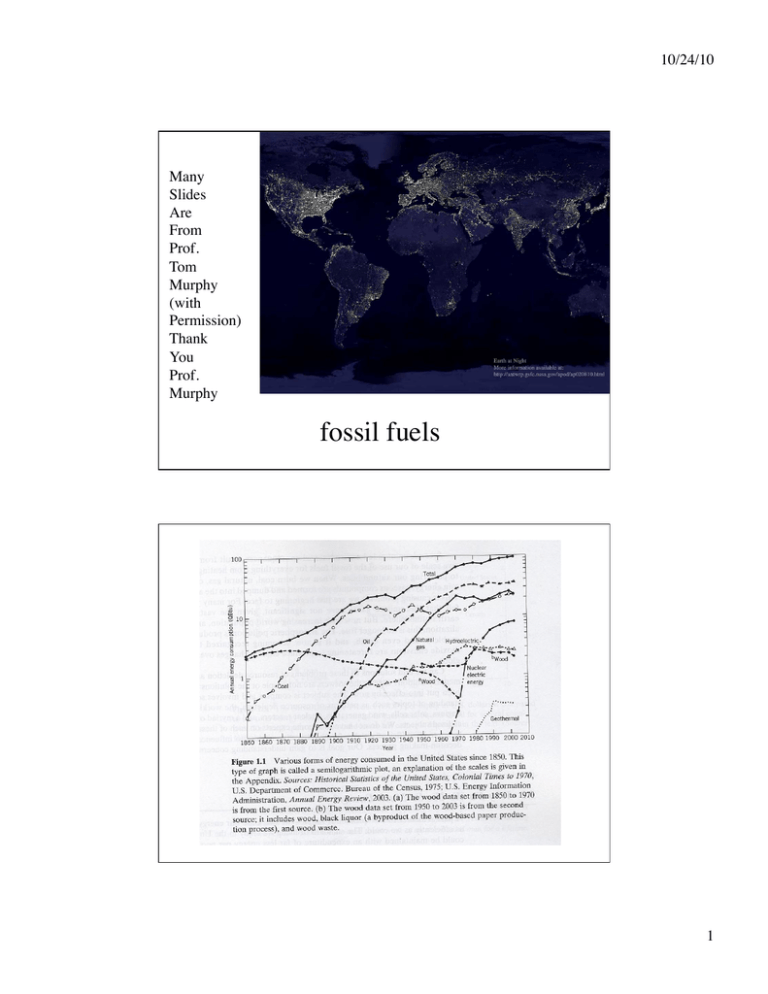
10/24/10 Many Slides Are From Prof. Tom Murphy (with Permission) Thank You Prof. Murphy fossil fuels 1 10/24/10 1018 Joules/yr Percent of Source (~QBtu/yr) Total Petroleum* 158 40.0 Coal* 92 23.2 Natural Gas* 89 22.5 Hydroelectric* 28.7 7.2 Nuclear Energy 26 6.6 Biomass 1.6 0.4 (burning)* Geothermal 0.5 0.13 Wind* 0.13 0.03 Solar Direct* 0.03 0.008 Sun Abs. by then radiated 2,000,000 Earth* away Global Energy: Where Does it Come From? * Ultimately derived from our sun Courtesy David Bodansky (UW) 2 10/24/10 Finding Oil • Oil is trapped in special (rare) geological structures • Most of the oil in the world comes from a few large wells • About one in ten exploratory drillings strike oil – and this in places known to be oil-rich: get nothing in most of world Q The Oil Window • Organic material must be deposited without decomposing – oxygen-poor environment: usually underwater with poor flow • Material must spend time buried below 7,500 feet of rock – so that molecules are “cracked” into smaller sizes • But must not go below 15,000 feet – else “cracked” into methane: gas, but no oil • So there is a window from 7,500 to 15,000 feet • Additional circumstances must be met – existence of “caprock” to keep oil from escaping: even a drop per second depletes 20 million barrels per million years – source rock must be porous and permeable to allow oil flow 3 10/24/10 The hydrocarbons kJ per gram 55 • All fossil fuels are essentially hydrocarbons, except coal, which is mostly just carbon • Natural Gas is composed of the lighter hydrocarbons (methane through pentane) • Gasoline is hexane (C6) through C12 • Lubricants are C16 and up (1 Cal = 4.184 kJ) 48 48 51 50 48 46 48 48 48 Read about Petroleum refining! Hydrocarbon Reactions • Methane reaction: CH4 + 2O2 → CO2 + 2H2O + energy 1 g 4 g 2.75 g 2.25 g 55 kJ • Octane reaction: 2C8H18 + 25O2 → 16CO2 + 18H2O + energy 1 g 3.51 g 3.09 g 1.42 g 48 kJ • For every pound of fuel you burn, you get about three times that in CO2 – one gallon of gasoline → ~20 pounds of CO2 – occupies about 5 cubic meters (1300 gallons) of space – U.S. uses 7.2 Gbbl/year: 42 gal/bbl * 6.3lb/gal * 1 ton/ 2000lb) => ~ Trillion tons gas/year => 20 T ton CO2/yr 4 10/24/10 Aside: Carbohydrate Reactions • Typical carbohydrate (sugar) has molecular structure like: [CH2O]N, where N is some integer – refer to this as “unit block”: C6H12O6 has N=6 (glucose/fructose) • Carbohydrate reaction: [CH2O]N + NO2 → NCO2 + NH2O + energy 1 g 1.07 g 1.47 g 0.6 g 17 kJ • Less energy than hydrocarbons because one oxygen already on board (half-reacted already) • For every pound of food you eat, exhale 1.5 lbs CO2 – Actually lose weight this way: 0.5 to 1.0 lbs per day in carbon – Must account for “borrowed” oxygen mass and not count it So where does our petroleum go? • Each barrel of crude oil goes into a wide variety of products • Most goes into combustibles • Some goes to lubricants • Some goes to pitch and tar • Some makes our plastics • 40% of our energy comes from petroleum 5 10/24/10 Who’s got the crude oil reserves? Data from several years back (Doesn’t count discoveries yet to be made) Countries with top oil reserves (World Oil Journal 2006) Saudi Arabia 262 Gbbl (Billion barrels) Iran 132 Gbbl Iraq 115 Kuwait 101 United Arab Emrites 70 Venezuela 53 Former Soviet Union 48 Nigeria 37 Libya 34 USA 21.7 China 16 Mexico 12.3 Canada 12 Brazil 11.9 Algeria 11.3 Angola 9 Norway 8 Sudan 6.1 Indonesia 5.0 India 4 6 10/24/10 Let’s get our barrels straight • An oil barrel (bbl) is 42 gallons, or 159 liters • In the U.S., we use about 24 bbl per year per person – average person goes through a barrel in 15 days – recall: 60 bbl/yr oil equivalent in all forms of energy: oil is 40% of our total energy portfolio • That’s 7.2 billion bbl/yr for the U.S. – 20 million bbl/day • For the world, it’s 25 billion bbl/year – 69 million bbl/day • 100 QBtu/yr = 17 Gboe/yr: world 400 QBtu/yr = 69 Gboe/yr (Gboe = billion barrel oil equivalent ~ 5.8 QBtu) Production rates and years left Country Prod (Gbbl/ Reserves year) (Gbbl) Saudi Arabia 3.3 262.7 Russia 2.9 U.S. 2.1 Iran No. Prod. Wells years left (R/P) 1,560 80 69.1 41,192 24 29.4 521,070 14 1.4 130.7 1,120 96 China 1.2 23.7 72,255 19 Mexico 1.2 16.0 Norway 1.0 10.1 U.A.E. 0.86 97.8 Canada 0.81 16.9 54,061 21 Kuwait 0.80 96.5 790 121 13 833 10 114 7 10/24/10 Question How many barrels of oil does the U.S. use each year? A. 100 QBtu B. 7 Billion bbl C. 7 Million bbl D. 20 Million bbl E. None of the above Question Every gallon of gasoline used results in how many pounds of CO2 released into the atmosphere? A. About 1 pound B. About 20 pounds C. About 1 tonne D. About 3 grams E. None of the above 8 10/24/10 Notes on Table • No single country matching U.S. demand of 7.2 Gbbl/year • Reserves: – Non-OPEC proved reserves: 173 Gbbl – OPEC reserves: 882 Gbbl – Total: 1055 Gbbl • To maintain current production of 25 Gbbl/year… – this will last 42.5 years – means entries in previous table with longer timescales than this would have to step up production, if they can – may not be possible to extract oil fast enough for demand – Saudi Arabia used to produce at less than 100% capacity, now running full-out Reserves, resources, economically recoverable • People often used "proved reserves" but there is more to be discovered: total is "economically recoverable total resource". But depends upon price. • E.g. in past 70% of oil left in ground (primary recovery) • Secondary recovery (pump in water) get another 15% • Tertiary recovery (pump in steam, CO2) get more, but each step increases cost. • E.g. amount of Uranium in world depends strongly on price willing to pay. • Finally, politics often comes into "proved reserves" (OPEC countries probably set reserves based on politics, not geology 9 10/24/10 King Hubbert and Peak Oil • Geophysicist at the Shell lab in Houston • In 1956, he presented a paper “Nuclear Energy and Fossil Fuels” at a meeting of the American Petroleum Institute in San Antonio • He made predictions of the peak year of US oil production based on two estimates of the ultimate production • Peak happened when “Texas railroad commission” (U.S. oil cartel after which OPEC was modeled) could no longer control price of oil; they were pumping flat out. (~1971, just when predicted). (Dave Rutledge: Caltech 2007) The Hubbert Peak Idea • Hitting new oil field must precede assessment of oil capacity • Discovery peak (numerical assessment) must follow hits • Production peak follows discovery (assessment) • Area under three curves the same (total oil resource) • Deffeyes estimates that we’ve hit 94%, discovered 82%, and produced 50% as of about 2005 10 10/24/10 Discovery must lead production • There must be a lag between the finding of oil and delivery to market • In the U.S., discovery peaked around 1950, production peaked in 1970 How about the U.S. Supply? • The estimated total U.S. supply is 230–324 billion bbl (currently used about 200 Gbbl of this) • We’ve used >60% of this, leaving 130 billion barrels max • Production is already down to 60% of peak • At current rate of production, must be exhausted before 2070 • If we used only U.S. supply, we’d run out in 18 years!! • If lower total above is right, less time Q 11 Logistic (“S”) curves exponential Logistic curves result from growth limited by a finite resource: at first exponential, but unable to sustain exponential once resource limits kick in logistic resource Qmax marks half-way point time Qmax resource rate of growth 10/24/10 time 12 10/24/10 Rate plot for U.S. • Can plot rate of production (P: annual production) divided by resource (Q: total produced to date) against total resource, Q – P/Q is like an interest rate: fractional increase per year Peak Production; half consumed 1970 • A “logistic” or S-curve would follow a straight line sloping down • U.S. oil production does so after 1958 • When you get to zero P/Q, you’ve hit the end of the resource: no more production Growth-Rate Plot for US Crude Oil Growth Rate for Cumulative . 10% 5% Trend line is for normal fit (225 billion barrels) 0% 0 100 200 Cumulative Production, billions of barrels • EIA data (cumulative from 1859, open symbols 1900-1930, closed symbols 1931-2006) (Dave Rutledge: Caltech 2007) 13 10/24/10 Same fit, in rate history plot • The best-fit line on the previous plot produces a decent fit to the rate history of oil production in the U.S. • Supports the peak position well, and implies a total resource of about 225 Gbbl • In this case, much proven reserves (22Gbbl) will not increase as many expect! How long will the world oil supply last? • Not as long as you might think/hope • We’ll be spent before the century is done, but we’ll have to scale down oil usage before then (in the next few decades) 14 10/24/10 Various Estimates of Oil Remaining • To date, we’ve used about 1000 billion barrels of oil worldwide • We seem to have about this much left – halfway through resource • There will be some future discovery still, but likely small beans – ANWR (Arctic National Wildlife Reserve): 5–10 Gbbl ~ 1 years’ worth at U.S. consumption rate • In any case, production unlikely to increase appreciably from this point forward – will soon fail to pump as fast as today’s demand Q Worldwide Discovery and Production • discovery peaked before 1970; production peak soon to follow 15 10/24/10 World Data • After 1983, world data follows logistic curve – shows us halfway along 2,000 Gbbl at 2005 – implies we’re at the peak right about now 2×Q Instructive example: British Coal 16 10/24/10 British Coal Production Annual Production, Mt . 300 (Slides from Dave Rutledge: Caltech: 2007) 200 100 0 1850 • • 1900 1950 2000 Data from the US National Bureau of Economic Research (1854-1876), the Durham Coal Mining Museum (1877-1956), and the British Department of Trade and Industry (1957-2006) In the peak production year, 1913, there were 3,024 mines Growth Rate for Cumulative . Growth-Rate Plot for British Coal 4% 2% 0% 0 5 10 15 20 25 Cumulative Production, Gt • • 1854-2006, 1853 cumulative from William Jevons, The Coal Question Already near the trend line in 1854 17 10/24/10 Growth Rate for Cumulative . Remaining Production for British Coal 0.2% 10% per year 0.1% Trend line for 200Mt remaining 0.0% 26.2 26.4 26.6 Cumulative Production, Gt Data from the UK Department of Trade and Industry (1993-2006) 6 producing underground mines ⎯ several with less than ten years of coal 35 strip mines are producing, but there are difficulties in getting permits for new mines Reserves vs Remaining Production 1000 Resources + Reserves Hull 100 Reserves Gt . • • • 10 Remaining Production 1 0 1850 • • • 1900 1950 2000 1864 reserves from Edward Hull of the Geological Survey Other data from the World Energy Council Surveys of Energy Resources Resources include seams of 2ft or more at depths of 4000ft or less 18 10/24/10 Reserves-to-Production Ratio for UK Coal R/P ratio, years 900 600 300 0 0 • • • 50 100 Years since Edward Hull's Reserve Survey in 1864 1864 reserves from Edward Hull of the Geological Survey Other data from the World Energy Council Surveys Current R/P ratio is 7 years Growth Rate for Cumulative . How Much Oil do the Saudis Have? 10% Trend line is for 1978 RAND study (90Gb remaining) Official Saudi reserves are 264 billion barrels 5% 0% 0 50 100 150 200 Cumulative Production, billions of barrels • • EIA data (open 1975-1990, closed 1991-2006), 1975 cumulative from Richard Nehring Matt Simmons was the first to call attention to this anomalous situation in his book, Twilight in the Desert (Dave Rutledge: Caltech 2007) 19 10/24/10 Countries with top oil reserves (World Oil Journal 2006) Saudi Arabia 262 Gbbl (Billion barrels) (Rutledge says only 90!) Iran 132 Gbbl Iraq 115 Kuwait 101 United Arab Emrites 70 Venezuela 53 Former Soviet Union 48 Nigeria 37 Libya 34 USA 21.7 China 16 Mexico 12.3 Canada 12 Brazil 11.9 Algeria 11.3 Angola 9 Norway 8 Sudan 6.1 Indonesia 5.0 India 4 Production rates and years left Country Prod (Gbbl/ Reserves year) (Gbbl) Saudi Arabia 3.3 262.7 (90?) Russia 2.9 U.S. 2.1 Iran No. Prod. Wells years left (R/P) 1,560 80 (27!?) 69.1 41,192 24 29.4 521,070 14 1.4 130.7 1,120 96 China 1.2 23.7 72,255 19 Mexico 1.2 16.0 Norway 1.0 10.1 U.A.E. 0.86 97.8 Canada 0.81 16.9 54,061 21 Kuwait 0.80 96.5 790 121 13 833 10 114 20 10/24/10 Shouldn’t we therefore discourage oil usage? • In this country, so far no such thing! • U.S. taxes on gasoline are 6.5 times lower than in most industrialized countries (about 32 cents per gallon in the U.S.) • Little meaningful increase in CAFE or efficiency standards • Efforts on the part of the U.S. to keep oil prices low have lead to numerous questionable actions on the international scene Q Natural Gas • Extracted as oil-drilling byproduct – was once burned off at well head as means of disposal • Mostly methane, some ethane, and a little propane, butane: less CO2 per Btu than oil or coal. • Measured in tcf (Trillion cubic feet) or bcf (billion cf) – 1 tcf = 1.035 QBtu! • 2 times cheaper than electricity per energy content, comparable to gasoline per joule – But getting more expensive; in 2004, nat gas was 3.5 times cheaper than electricity, now only 2.1 times cheaper than electricity (for same energy) (and 2.5 times cheaper than current gasoline) • Well-suited to on-the-spot heat generation: water heaters, furnaces, stoves/ovens, clothes dryers – more efficient than using fossil-fuel-generated electricity 21 10/24/10 Distribution of natural gas • Impractical to ship: must route by pipe • 1.3 million miles of pipe (250,000 miles of mains) How much do we use, and where do we get it? • In 2003, we used 21.8 Tcf (Tera-cubic feet, or 1012ft3); about 23 QBtu (23% of total) – (Luckily 1QBtu ~ 1 Tcf nat gas) • Out of the 21.8 tcf used, 88% was domestic – 11.8% from Canada – 0.08% from Algeria (shipped in liquefied form) – 0.03% from Mexico • Total U.S. has used about 1,100 Tcf to date = about 1100 QBtu = about 190 Gboe worth of nat gas. • You pay about SDG&E about $1.00/therm (they pay about $0.50/ therm; therm (=100,000Btu) is about 100cf of nat gas (electicity is about $0.11/kWh => 1 therm worth of electricity costs about $3.22. • If car ran off nat gas cost would be per "gallon” of energy: (125,000 Btu/gal) ($1/therm)(1therm/100,000Btu) = $1.25/gal • If car ran off electricity cost would be per "gallon” of energy: (125,000 Btu/gal) ($0.11/kWh)(1kWh/3413 Btu) = $4.03/gal (BUT electric engines are more efficient => less energy needed to go same distance) Q 22 10/24/10 How much do we have left? • Estimated recoverable amount: 871 tcf • 40 years at current rate • Estimates like this do account for future discoveries – present proven reserves provide only 8 years’ worth – Are discoveries going to be made as predicted? (2006 numbers now show proved reserves at about 204 tcf, not 189) – And above assumes we don’t increase usage of this cleaner and cheaper energy source 23 10/24/10 Countries with top nat gas reserves (World Oil Journal 2006) Russia 1689 (Tcf) 290 Gboe Iran 965 160 Quatar 906 150 Saudi Arabia 243 41 UAE 205 35 USA 204 35 Nigeria 182 31 Algeria 160 27 Venezuela 151 26 Australia 120 20 Indonesia 92 16 Iraq 84 14 Norway 83 14 Eygpt 67 11 Kazakhstan 65 11 Malaysia 58 10 Kuwait 57 10 China 56 10 Canada 54 9 Libya 52 9 Netherlands 51 9 Afghanistan and natural gas? Check the article: by John Foster http://www.policyalternatives.ca/documents/National_Office_Pubs/2008/ A_Pipeline_Through_a_Troubled_Land.pdf TAPI backed by U.S. runs through Taliban Kandhar areas; U.S. opposes IPI which would help Iran (both cost around 7 billion $). 24 10/24/10 World Natural gas • Total proven reserves about 6200 Tcf ~ 1060Gboe ~ 6000 Qbtu, about same energy content as world’s oil proven reserves • U.S. only 3% of total • Undiscovered amount quite uncertain • Could also get methane from coal seams, deep sea hydrates; potentially very large amounts • LNG: Transport at T=-260F makes 600 times smaller volume Coal • • • • Coal is a nasty fuel that we seem to have a lot of Primarily carbon, but some volatiles (CO, CH4) Reaction is essentially C + O2 → CO2 + energy Energy content varies depending on quality of coal, ranging from 5–8 Cal/g • Highly polluting because of large amounts of ash, sulphur dioxide, arsenic, and other pollutants, plus must dig up ground over large areas; more radioactivity from coal than nuclear (if ignore Chernobyl!) 25 10/24/10 Coal • Coal made differently from other fossil fuels and found differently • Starting 300 million years ago, swamps • Lies in strata called seams 2-8ft thick usually about 300 ft down • In U.S. Rocky Mountain coal is cleanest, but not highest energy content. American Coal 26 10/24/10 Western Coal Natural Graphite Anthracite Coal types and composition fixed carbon ash kJ/g 34 29 Bituminous 35 Bituminous 31 subbituminous 27 Lignite 25 moisture content Peat Wood volatile matter 21 20 27 10/24/10 Use of Coal • 88% of the coal used in the U.S. makes steam for electricity generation • 7.7% is used for industry and transportation • 3.5% used in steel production • 0.6% used for residential and commercial purposes • 0.00001% used on Halloween for trick-ortreaters US Coal Production Annual Production, Mt . 1,000 Total 500 West of the Mississippi 0 1850 • • 1900 1950 2000 Data from the USGS (Robert Milici) Will consider the East and the West separately (Dave Rutledge: Caltech 2007) 28 10/24/10 Anthracite in Pennsylvania Annual Production, Mt . 80 60 40 20 0 1850 • • 1900 1950 Data from the USGS (Robert Milici) Anthracite is a grade of coal used for home heating that burns with little smoke (Dave Rutledge: Caltech 2007) Growth-Rate Plot for PA Anthracite Growth Rate for Cumulative 6% 4% 2% 0% 0 1 2 3 4 5 Cumulative Production, Gt • • Data from the USGS (Robert Milici) cumulative from 1800, symbols 1875-1995 16% of the 1913 reserves were eventually produced (Dave Rutledge: Caltech 2007) 29 10/24/10 (1 tonne coal = 5.06 boe) Estimated Worldwide Coal Reserves Country Amount Percentage (G tonne/Gboe) of Total United States 250 Gtonne / 1260 Gboe 25 Russia 230 / 1160 23 Europe 138 / 700 14 China 115 / 580 12 Australia 82 / 420 8.3 Africa 55 / 280 5.6 South America 22 / 110 2.2 Mex/Canada 7.7 / 40 0.8 Total 984 Gtonne / 5000 Gboe 100 Let’s get our barrels straight • An oil barrel (bbl) is 42 gallons, or 159 liters • In the U.S., we use about 24 bbl per year per person – average person goes through a barrel in 15 days – recall: 60 bbl/yr oil equivalent in all forms of energy: oil is 40% of our total energy portfolio • That’s 7.2 billion bbl/yr for the U.S. – 20 million bbl/day • For the world, it’s 25 billion bbl/year – 69 million bbl/day • 100 Qbtu/yr = 17 Gboe/yr: world 400 Qbtu/yr = 69 Gboe/yr (Gboe = billion barrel oil equivalent ~ 5.8 QBtu) 30 10/24/10 When will coal run out? Note numbers are much larger than current estimates; the estimates changed recently! • We use 109 tonnes of coal per year, so the U.S. supply alone could last as long as 250 years at current rate • Using variable rate model, more like 75-100 years – especially relevant if oil, gas are gone • This assumes global warming doesn’t end up banning the use of coal: Ralph Keeling of Scripts SIO says we will run out of atmosphere before we run out of coal. He says keeping coal in the ground is the single most important thing for climate change • Environmental concerns over extraction also relevant (i.e. pollution) Shale Oil • Possibly 600–2000 billion barrels of oil in U.S. shale deposits – compare to total U.S. oil supply of max 230 billion bbl • Economically viable portion may only be 80 billion bbl • 8 times less energy density than coal – lots of waste rock: large-scale disposal problem – takes lots of water • Maximum rate of extraction may be only 5% of our current rate of oil consumption – limited by water availability 31 10/24/10 Fort McMurray, Alberta Oil Sands 32 10/24/10 Tar Sands • Sand impregnated with viscous tar-like sludge • Huge deposit in Alberta, Canada – 300 billion bbl possibly economically recoverable – Perhaps 1/3 of world total • It takes two tons of sands to create one barrel of oil – energy density similar to that of shale oil, much less than coal – Needs to be heated => Canada nuclear plant just for that! – Takes lots of water • In 2003, 1 million bbl/day produced • 2002 production cost was $20 per barrel, so economically competitive; Canadian Oil Sands • 1.0 Mb per day in 2005, increasing 8% per year • 35Gb reserves for mining (comparable to one year of world oil production) • 140Gb reserves for wells – Production with a steam process – Production and upgrading to synthetic crude oil use 25% of the oil energy equivalent in natural gas – Canadian gas reserves are 10Gboe (end of 2005) – Annual gas production is 12% of reserves per year – Challenges in meeting obligations under the Kyoto agreement 33 10/24/10 Summary of world fossil fuel sources • • • • Oil: 1000 Gbbl (trend) - 1500 Gbbl Nat gas: ~1000 Gboe (proved) -? (exploration not as complete as oil) Tar sands: ~500 Gboe (quite uncertain how much economically recoverable) Rutledge uses Hubbert trend analysis to estimate total liquid/gas hydrocarbons to be 3000Gboe; German govt. says 2700Gboe • Coal: World Energy Council (used by DoE) says ~5000 Gboe, but Hubbert type trend analysis says only 3200 Gboe; IPCC uses old numbers of 18000 Gboe (important since burning this gives predictions of climate change, sea level rise, etc.) • Shale oil: 80Gboe - 800Gboe or so depending on price, etc. • Deep sea clathrate (methane hydrates): could be more energy in these than all of the above combined! (but no one has figured out how to get at them and to turn them in to useful energy) Cumulative Production,Tboe . World Hydrocarbon Production 4 3 2 0 1960 • • 3000Gboe remaining 1 1980 2000 2020 2040 2060 2080 2100 Cumulative normal (ultimate 4.6Tboe, lms fit for mean 2018, sd 35 years) IPCC scenarios assume that 11 to 15Tboe is available 34 10/24/10 Growth Rate for Cumulative . Growth-Rate Plot for World Hydrocarbons 6% 4% Trend line for 3Tboe remaining 2% 0% 0 1 2 3 Cumulative Production, trillion barrels of oil equivalent • • • Oil + natural gas + natural gas liquids like propane and butane Data 1965, 1972, 1981, 2006 BP Statistical Review (open 1960-1982, closed 1983-2005) The German resources agency BGR gives hydrocarbon reserves as 2.7Tboe – Expectation of future discoveries and future OPEC oil reserve reductions – Includes 500Gboe for non-conventional sources like Canadian oil sands 35 10/24/10 Energy is cheap! So what’s the problem? • We spend about $20/day, or $7,300/yr per person on energy in the U.S. (about 20% of GDP) – about 20% of GDP – saves us much more than 20% of our time (labor-saving devices, transportation, etc.) • But we’re running through our resources at a phenomenal rate • Our world will see a profound change in the next century as we adjust to a world without gasoline 36 10/24/10 OLD info: out of date 37 10/24/10 Cumulative Production, Gt . Cumulative British Coal Production Pre-war fit 20 Post-war fit 10 0 1850 • • 1900 1950 2000 Pre-war lms fit (1854-1945, ultimate 25.6Gt, mean 1920, sd 41 years) Post-war lms fit (1946-2006, ultimate 27.2Gt, mean 1927, sd 39 years) 38
