Table 5—Results of aquifer tests EXPLANATION
advertisement
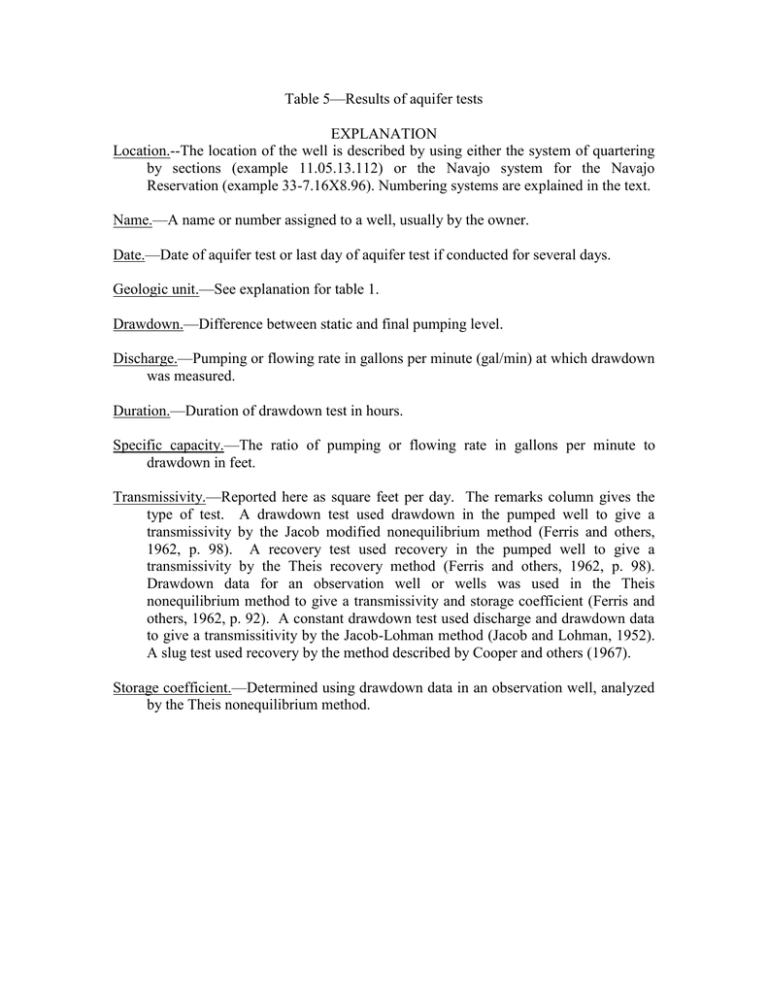
Table 5—Results of aquifer tests EXPLANATION Location.--The location of the well is described by using either the system of quartering by sections (example 11.05.13.112) or the Navajo system for the Navajo Reservation (example 33-7.16X8.96). Numbering systems are explained in the text. Name.—A name or number assigned to a well, usually by the owner. Date.—Date of aquifer test or last day of aquifer test if conducted for several days. Geologic unit.—See explanation for table 1. Drawdown.—Difference between static and final pumping level. Discharge.—Pumping or flowing rate in gallons per minute (gal/min) at which drawdown was measured. Duration.—Duration of drawdown test in hours. Specific capacity.—The ratio of pumping or flowing rate in gallons per minute to drawdown in feet. Transmissivity.—Reported here as square feet per day. The remarks column gives the type of test. A drawdown test used drawdown in the pumped well to give a transmissivity by the Jacob modified nonequilibrium method (Ferris and others, 1962, p. 98). A recovery test used recovery in the pumped well to give a transmissivity by the Theis recovery method (Ferris and others, 1962, p. 98). Drawdown data for an observation well or wells was used in the Theis nonequilibrium method to give a transmissivity and storage coefficient (Ferris and others, 1962, p. 92). A constant drawdown test used discharge and drawdown data to give a transmissitivity by the Jacob-Lohman method (Jacob and Lohman, 1952). A slug test used recovery by the method described by Cooper and others (1967). Storage coefficient.—Determined using drawdown data in an observation well, analyzed by the Theis nonequilibrium method.
