Selected Acquisition Report (SAR) MH-60R UNCLASSIFIED As of December 31, 2011
advertisement
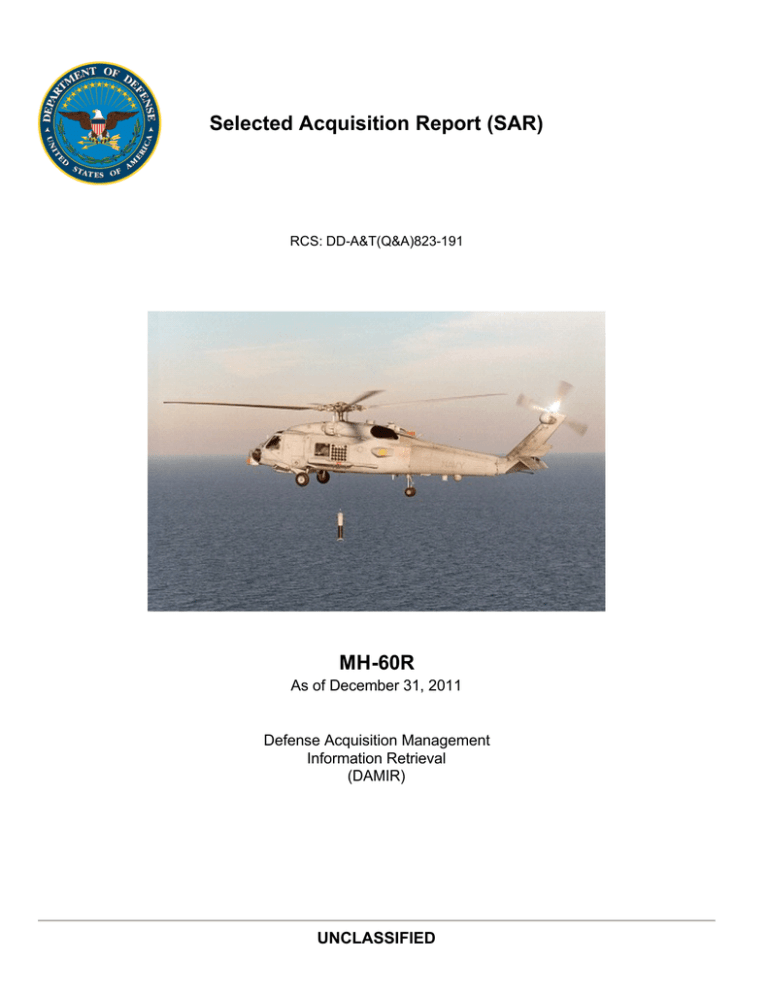
Selected Acquisition Report (SAR) RCS: DD-A&T(Q&A)823-191 MH-60R As of December 31, 2011 Defense Acquisition Management Information Retrieval (DAMIR) UNCLASSIFIED MH-60R December 31, 2011 SAR Table of Contents Program Information Responsible Office References Mission and Description Executive Summary Threshold Breaches Schedule Performance Track To Budget Cost and Funding Low Rate Initial Production Nuclear Cost Foreign Military Sales Unit Cost Cost Variance Contracts Deliveries and Expenditures Operating and Support Cost 3 3 3 4 4 5 6 8 9 10 16 17 17 18 21 24 30 31 UNCLASSIFIED 2 MH-60R December 31, 2011 SAR Program Information Designation And Nomenclature (Popular Name) MH-60R Multi-Mission Helicopter (MH-60R) DoD Component Navy Responsible Office Responsible Office CAPT James Glass Air Anti-Submarine Warfare, Assault and Special Mission Programs (PMA-299) 47123 Buse Rd Unit IPT, Suite 156 Patuxent River, MD 20670-1547 james.glass@navy.mil Phone Fax DSN Phone DSN Fax 301-757-5409 301-757-5276 757-5409 757-5276 Date Assigned July 28, 2011 References SAR Baseline (Production Estimate) Defense Acquisition Executive (DAE) Approved Acquisition Program Baseline (APB) dated March 22, 2006 Approved APB Navy Acquisition Executive (NAE) Approved Acquisition Program Baseline (APB) dated November 29, 2010 UNCLASSIFIED 3 MH-60R December 31, 2011 SAR Mission and Description The MH-60R primary mission areas include Anti-Submarine Warfare (ASW) and Surface Warfare (SUW). Secondary mission areas include Search and Rescue (SAR), Vertical Replenishment (VERTREP), Naval Surface Fire Support (NSFS), logistics support, personnel transport, Medical Evacuation (MEDEVAC), and VHF/UHF/Link Communication Relay (COMREL). The MH-60R is the central component of the "Navy Helicopter Master Plan" and the Chief of Naval Operations (CNO) approved Helicopter Concept of Operations (CONOPS) that replaces the aging SH-60B and SH-60F helicopters. The avionics upgrades over the existing SH-60B/F include: a glass cockpit common with the MH-60S; Airborne Low Frequency Sonar (ALFS) as a long range active dipping sonar; Electronic Support Measures (ESM) with expanded frequency coverage and location detection; Multi-Mode Radar (MMR) with long range search, periscope detection, and imaging Inverse Synthetic Aperture Radar (ISAR); Forward Looking Infra-Red (FLIR) for imaging and laser target designation; Acoustic Processor (AP) for processing ALFS and sonobuoys; Integrated Self Defense (ISD); and the Mission Planning System (MPS). MH-60R sensors and real-time exchange of tactical data with the host ship will bring a new dimension of battle space control to the Naval Commander. Executive Summary A total of 122 MH-60R aircraft have been delivered to the Fleet as of February 29, 2012. To date, seven MH-60R squadrons have been established or transitioned from SH-60Bs. The fourth MH-60R operational deployment is currently underway. Full Rate Production (FRP) deliveries to the Fleet continue on-schedule in support of additional squadron stand-ups and transitions. The FY 2012 National Defense Authorization Act and Consolidated Appropriations Act included Congressional authority to enter into the MH-60R/S Mission Systems and Common Cockpit Multiyear Procurement (MYP) contract (MY2) FY 2012-2016 as well as airframes for Army UH-60M/HH-60M helicopters and Navy MH-60R/MH-60S helicopters MYP contract (MY8) FY 2012-2016. The MH-60R/S Mission Systems and Common Cockpit MY2 contract with Lockheed Martin Mission Systems and Sensors (LM MS2) is scheduled to be awarded in the second quarter of FY 2012. The MH-60R/S Airframe MY8 contract with Sikorsky Aircraft Corporation (SAC) is scheduled to be awarded in the third quarter of FY 2012. System Development and Demonstration (SDD) of the Automatic Radar Periscope Detection and Discrimination (ARPDD) program continued. Two Integrated Test (IT) periods were successfully completed and another IT period commenced December 07, 2011 and is scheduled to complete in March 2012. The Operational Test is scheduled to begin in May 2012 and the program is on track for Initial Operating Capability (IOC) in July 2013. There are no significant software-related issues with this program at this time. UNCLASSIFIED 4 MH-60R December 31, 2011 SAR Threshold Breaches APB Breaches Schedule Performance Cost RDT&E Procurement MILCON Acq O&M Unit Cost PAUC APUC Nunn-McCurdy Breaches Current UCR Baseline PAUC None APUC None Original UCR Baseline PAUC None APUC None UNCLASSIFIED 5 MH-60R December 31, 2011 SAR Schedule Milestones Milestone II TECHEVAL Start Complete OPEVAL Start Complete Initial Operating Capability Milestone III Automatic Radar Periscope Detection and Discriminator (ARPDD) ARPDD Interim Process Review (IPR) (System Design Development (SDD) Award) ARPDD Critical Design Review (CDR) Operational Test (OT) Start Initial Operational Capability (IOC) SAR Baseline Prod Est JUL 1993 Current APB Production Objective/Threshold JUL 1993 JAN 1994 JUL 1993 OCT 2004 FEB 2005 OCT 2004 FEB 2005 APR 2005 AUG 2005 AUG 2004 FEB 2005 MAY 2005 SEP 2005 DEC 2005 JAN 2006 MAY 2005 SEP 2005 DEC 2005 JAN 2006 NOV 2005 MAR 2006 JUN 2006 JUL 2006 MAY 2005 SEP 2005 DEC 2005 MAR 2006 N/A APR 2008 OCT 2008 APR 2008 N/A N/A N/A JUN 2009 MAY 2012 JUL 2013 DEC 2009 NOV 2012 JAN 2014 APR 2009 MAY 2012 JUL 2013 UNCLASSIFIED Current Estimate 6 MH-60R December 31, 2011 SAR Acronyms And Abbreviations OPEVAL - Operational Evaluation TECHEVAL - Technical Evaluation Change Explanations None UNCLASSIFIED 7 MH-60R December 31, 2011 SAR Performance Characteristics Availability (%): Mission Capable Net Ready: All interfaces, services, policy-enforcement, controls, and datasharing of the NCOW RM and GIG-KIPs will be satisfied to the requirements of the specific Joint integrated architecture products (including data correctness, data availability, and data processing), and information assurance accreditation specified in the threshold and objective values. Crew Protection: Crashworthiness, Crew Restraint, and Egress SAR Baseline Prod Est Current APB Production Objective/Threshold 82 70 Demonstrated Performance 82.3% 82% 100% of requirements 100% of 100% of requirements enterprise level or critical requirements 100% of enterprise level or critical requirements 100% of enterprise level or critical requirements Crew Seating 35/25/20G, Passenger 20/20/20 Crew Seating 35/25/20G, Passenger 20/20/20 Crew Seating 20/20/20G, Passenger 14/13/12G Crew Seating 20/20/20G, Passenger 14/13/12G 82 Crew Seating 20/20/20G, Passenger 14/13/12G Current Estimate Requirements Source: Capability Production Document (CPD) Approved by Joint Requirements Oversight Council Memorandum (JROCM) 260-05 on November 28, 2005 Acronyms And Abbreviations G - Gravitational Force GIG - Global Information Grid KIPs - Key Interface Profiles NCOW RM - Net-Centric Operations & Warfare Reference Model Change Explanations None Classified Performance information is provided in the classified annex to this submission. UNCLASSIFIED 8 MH-60R December 31, 2011 SAR Track To Budget RDT&E APPN 1319 APPN 1319 BA 05 PE 0604212N Project H2412 ASW & OTHER HELO DEVELOPMENT/MH-60R LAMPS BA 05 PE 0604216N Project 1707 Project H9215 MULTI-MISSION HELO UPGRADE DEVELOPMENT/MH-60R MULTI-MISSION HELO UPGRADE DEVELOPMENT/MH-60 PMLCC BA 01 PE 0204243N ICN 018200 MH-60R BA 06 PE 0204243N (Navy) (Sunk) (Navy) (Sunk) Procurement APPN 1506 APPN 1506 ICN 0605 (Navy) (Navy) (Shared) UNCLASSIFIED 9 MH-60R December 31, 2011 SAR Cost and Funding Cost Summary Total Acquisition Cost and Quantity BY2006 $M BY2006 $M Appropriation SAR Baseline Prod Est RDT&E Procurement Flyaway Recurring Non Recurring Support Other Support Initial Spares MILCON Acq O&M Total TY $M Current APB Current Production Estimate Objective/Threshold 1519.0 9108.0 7386.3 6726.4 659.9 1721.7 1535.1 186.6 0.0 0.0 10627.0 1718.9 11360.2 ------0.0 0.0 13079.1 1890.8 12495.9 --------N/A SAR Baseline Prod Est 1818.2 11263.6 9546.1 8311.7 1234.4 1717.5 1434.3 283.2 0.0 0.0 13081.8 1375.7 10049.0 8176.2 7471.0 705.2 1872.8 1682.7 190.1 0.0 0.0 11424.7 Current APB Current Production Estimate Objective 1570.4 1678.7 12573.5 12578.6 -- 10707.3 -- 9348.3 -- 1359.0 -- 1871.3 -- 1573.1 -298.2 0.0 0.0 0.0 0.0 14143.9 14257.3 Confidence Level For the Current APB Cost is 50% - The current APB cost estimate provided sufficient resources to execute the program under normal conditions, encountering average levels of technical, schedule and programmatic risk and external interference. It was consistent with average resource expenditures on historical efforts of similar size, scope, and complexity and represents a notional 50% confidence level. Quantity RDT&E Procurement Total SAR Baseline Prod Est Current APB Production 2 252 254 UNCLASSIFIED 2 298 300 Current Estimate 2 289 291 10 MH-60R December 31, 2011 SAR Cost and Funding Funding Summary Appropriation and Quantity Summary FY2013 President's Budget / December 2011 SAR (TY$ M) Appropriation Prior RDT&E Procurement MILCON Acq O&M PB 2013 Total PB 2012 Total Delta 1645.8 7077.3 0.0 0.0 8723.1 8726.7 -3.6 Quantity Development Production PB 2013 Total PB 2012 Total Delta To Total Complete 0.0 0.0 1678.7 82.7 0.0 12578.6 0.0 0.0 0.0 0.0 0.0 0.0 82.7 0.0 14257.3 83.5 0.0 14399.9 -0.8 0.0 -142.6 FY2012 FY2013 FY2014 FY2015 FY2016 FY2017 17.5 1012.7 0.0 0.0 1030.2 1045.9 -15.7 6.9 843.1 0.0 0.0 850.0 986.8 -136.8 3.6 985.8 0.0 0.0 989.4 1067.3 -77.9 4.9 1211.8 0.0 0.0 1216.7 1138.4 78.3 0.0 1365.2 0.0 0.0 1365.2 1351.3 13.9 To Total Complete 0 0 2 0 0 289 0 0 291 0 0 300 0 0 -9 Undistributed Prior FY2012 FY2013 FY2014 FY2015 FY2016 FY2017 2 0 2 2 0 0 158 158 158 0 0 24 24 24 0 0 19 19 24 -5 0 19 19 24 -5 UNCLASSIFIED 0 31 31 31 0 0 38 38 37 1 11 MH-60R December 31, 2011 SAR Cost and Funding Annual Funding By Appropriation Annual Funding TY$ 1319 | RDT&E | Research, Development, Test, and Evaluation, Navy Non End End Item Non Item Total Total Total Fiscal Recurring Recurring Quantity Recurring Flyaway Support Program Year Flyaway Flyaway Flyaway TY $M TY $M TY $M TY $M TY $M TY $M 1990 ------10.2 1991 ------28.5 1992 ------53.0 1993 ------72.7 1994 ------70.7 1995 ------70.0 1996 ------65.1 1997 ------55.2 1998 ------85.3 1999 ------209.0 2000 ------110.1 2001 ------77.8 2002 ------133.7 2003 ------89.9 2004 ------81.9 2005 ------80.1 2006 ------57.8 2007 ------28.9 2008 ------74.2 2009 ------67.9 2010 ------69.4 2011 ------54.4 2012 ------17.5 2013 ------6.9 2014 ------3.6 2015 ------4.9 Subtotal 2 -----1678.7 UNCLASSIFIED 12 MH-60R December 31, 2011 SAR Annual Funding BY$ 1319 | RDT&E | Research, Development, Test, and Evaluation, Navy Non End End Item Non Item Total Total Total Fiscal Recurring Recurring Quantity Recurring Flyaway Support Program Year Flyaway Flyaway Flyaway BY 2006 $M BY 2006 $M BY 2006 $M BY 2006 $M BY 2006 $M BY 2006 $M 1990 ------13.7 1991 ------36.8 1992 ------66.6 1993 ------89.2 1994 ------85.2 1995 ------82.7 1996 ------75.7 1997 ------63.4 1998 ------97.1 1999 ------235.3 2000 ------122.1 2001 ------85.1 2002 ------144.9 2003 ------96.0 2004 ------85.1 2005 ------81.1 2006 ------56.7 2007 ------27.7 2008 ------69.8 2009 ------63.1 2010 ------63.5 2011 ------48.8 2012 ------15.4 2013 ------6.0 2014 ------3.1 2015 ------4.1 Subtotal 2 -----1818.2 UNCLASSIFIED 13 MH-60R December 31, 2011 SAR Annual Funding TY$ 1506 | Procurement | Aircraft Procurement, Navy Non End End Item Non Item Total Total Total Fiscal Recurring Recurring Quantity Recurring Flyaway Support Program Year Flyaway Flyaway Flyaway TY $M TY $M TY $M TY $M TY $M TY $M 2000 5 175.9 -25.8 201.7 35.3 237.0 2001 ---44.7 44.7 7.3 52.0 2002 ---11.2 11.2 3.8 15.0 2003 -32.5 -36.5 69.0 52.4 121.4 2004 4 168.4 -68.4 236.8 108.7 345.5 2005 6 204.0 -71.4 275.4 155.4 430.8 2006 12 394.8 -58.2 453.0 204.0 657.0 2007 25 714.7 -71.9 786.6 131.3 917.9 2008 28 868.9 -95.2 964.1 115.6 1079.7 2009 30 924.8 -121.7 1046.5 146.4 1192.9 2010 24 674.1 -104.2 778.3 176.4 954.7 2011 24 732.8 -110.5 843.3 230.1 1073.4 2012 24 844.0 -69.0 913.0 99.7 1012.7 2013 19 711.5 -78.4 789.9 53.2 843.1 2014 19 801.8 -111.1 912.9 72.9 985.8 2015 31 1032.0 -109.3 1141.3 70.5 1211.8 2016 38 1068.1 -171.5 1239.6 125.6 1365.2 2017 -----82.7 82.7 Subtotal 289 9348.3 -1359.0 10707.3 1871.3 12578.6 UNCLASSIFIED 14 MH-60R December 31, 2011 SAR Annual Funding BY$ 1506 | Procurement | Aircraft Procurement, Navy Non End End Item Non Item Total Total Total Fiscal Recurring Recurring Quantity Recurring Flyaway Support Program Year Flyaway Flyaway Flyaway BY 2006 $M BY 2006 $M BY 2006 $M BY 2006 $M BY 2006 $M BY 2006 $M 2000 5 192.9 -28.3 221.2 38.7 259.9 2001 ---48.4 48.4 7.9 56.3 2002 ---12.0 12.0 4.1 16.1 2003 -34.1 -38.3 72.4 55.0 127.4 2004 4 172.1 -69.9 242.0 111.2 353.2 2005 6 202.8 -71.0 273.8 154.5 428.3 2006 12 381.9 -56.3 438.2 197.3 635.5 2007 25 675.6 -68.0 743.6 124.1 867.7 2008 28 809.2 -88.7 897.9 107.6 1005.5 2009 30 849.2 -111.7 960.9 134.5 1095.4 2010 24 607.7 -93.9 701.6 159.1 860.7 2011 24 648.9 -97.8 746.7 203.8 950.5 2012 24 734.7 -60.1 794.8 86.8 881.6 2013 19 609.0 -67.1 676.1 45.5 721.6 2014 19 674.3 -93.4 767.7 61.3 829.0 2015 31 852.5 -90.4 942.9 58.2 1001.1 2016 38 866.8 -139.1 1005.9 102.0 1107.9 2017 -----65.9 65.9 Subtotal 289 8311.7 -1234.4 9546.1 1717.5 11263.6 UNCLASSIFIED 15 MH-60R December 31, 2011 SAR Cost Quantity Information 1506 | Procurement | Aircraft Procurement, Navy End Item Recurring Flyaway Fiscal (Aligned Quantity Year with Quantity) BY 2006 $M 2000 5 192.9 2001 --2002 --2003 --2004 4 169.2 2005 6 170.6 2006 12 326.7 2007 25 686.6 2008 28 781.5 2009 30 857.6 2010 24 633.5 2011 24 641.9 2012 24 665.9 2013 19 632.3 2014 19 603.4 2015 31 949.0 2016 38 1000.6 2017 --Subtotal 289 8311.7 Low Rate Initial Production Approval Date Approved Quantity Reference Start Year End Year Initial LRIP Decision 5/10/1999 21 ADM 2002 2007 Current Total LRIP 4/5/2005 15 ADM 2002 2007 In May 1999, Low Rate Initial Production (LRIP) was approved by Assistant Secretary of the Navy Research, Development and Acquisition ASN(RDA) for a total LRIP quantity of 21, which was 8.6% of the total procurement (243). In April 2005, an Acquisition Decision Memorandum was approved to reduce the LRIP quantity from 21 to 15 which was 5.0% of the total procurement (298). Program is now in Full Rate Production (FRP). UNCLASSIFIED 16 MH-60R December 31, 2011 SAR Foreign Military Sales Australia Date of Quantity Sale 6/6/2011 Australia 6/6/2011 Country Total Memo Cost $M 743.5 Total Cost based on Letter of Offer and Acceptance (LOA) signed June 6, 2011 for Through Life Support (TLS), Support Equipment and Training. 24 2052.7 Total Cost based on LOA signed June 6, 2011. Nuclear Cost None UNCLASSIFIED 17 MH-60R December 31, 2011 SAR Unit Cost Unit Cost Report BY2006 $M Current UCR Baseline (NOV 2010 APB) Unit Cost Program Acquisition Unit Cost (PAUC) Cost Quantity Unit Cost Average Procurement Unit Cost (APUC) Cost Quantity Unit Cost Program Acquisition Unit Cost (PAUC) Cost Quantity Unit Cost Average Procurement Unit Cost (APUC) Cost Quantity Unit Cost Current Estimate (DEC 2011 SAR) BY % Change 13079.1 300 43.597 13081.8 291 44.955 +3.11 11360.2 298 38.121 11263.6 289 38.974 +2.24 BY2006 $M Revised Original UCR Baseline (MAY 2004 APB) Unit Cost BY2006 $M BY2006 $M Current Estimate (DEC 2011 SAR) BY % Change 9894.9 243 40.720 13081.8 291 44.955 +10.40 8361.1 241 34.693 11263.6 289 38.974 +12.34 UNCLASSIFIED 18 MH-60R December 31, 2011 SAR Unit Cost History Date JUN 1995 MAY 2004 MAY 2004 SEP 2008 NOV 2010 DEC 2010 DEC 2011 Original APB APB as of January 2006 Revised Original APB Prior APB Current APB Prior Annual SAR Current Estimate BY2006 $M PAUC APUC 26.155 22.846 40.208 34.255 40.208 34.255 42.626 36.143 43.597 38.121 44.343 38.529 44.955 38.974 TY $M PAUC 29.981 41.427 41.427 45.746 47.146 48.000 48.994 APUC 27.062 36.090 36.090 39.877 42.193 42.682 43.525 SAR Unit Cost History Initial SAR Baseline to Current SAR Baseline (TY $M) Initial PAUC Dev Est 44.979 Econ -1.370 Qty -18.295 Sch 0.747 Changes Eng Est 3.963 11.669 Oth 0.000 Spt 3.286 Total 0.000 PAUC Prod Est 44.979 Current SAR Baseline to Current Estimate (TY $M) PAUC Prod Est 44.979 Econ -0.245 Qty -2.017 Sch 0.444 Changes Eng Est 0.841 4.957 UNCLASSIFIED Oth 0.000 Spt Total 0.035 4.015 PAUC Current Est 48.994 19 MH-60R December 31, 2011 SAR Initial SAR Baseline to Current SAR Baseline (TY $M) Initial APUC Dev Est 39.877 Econ -1.249 Qty -15.767 Sch 0.753 Changes Eng Est 3.098 10.132 Oth 0.000 APUC Prod Est 39.877 Spt Total 3.033 0.000 Current SAR Baseline to Current Estimate (TY $M) APUC Prod Est 39.877 Econ -0.217 Qty -1.378 Sch 0.447 Changes Eng Est 0.135 4.625 Oth 0.000 Spt Total 0.036 3.648 APUC Current Est 43.525 SAR Baseline History Item/Event Milestone I Milestone II Milestone III IOC Total Cost (TY $M) Total Quantity Prog. Acq. Unit Cost (PAUC) SAR Planning Estimate (PE) N/A N/A N/A N/A N/A N/A N/A SAR Development Estimate (DE) N/A JUL 1993 OCT 2001 MAR 2001 11424.7 254 44.979 UNCLASSIFIED SAR Production Estimate (PdE) N/A JUL 1993 JAN 2006 DEC 2005 11424.7 254 44.979 Current Estimate N/A JUL 1993 MAR 2006 DEC 2005 14257.3 291 48.994 20 MH-60R December 31, 2011 SAR Cost Variance Cost Variance Summary SAR Baseline (Prod Est) Previous Changes Economic Quantity Schedule Engineering Estimating Other Support Subtotal Current Changes Economic Quantity Schedule Engineering Estimating Other Support Subtotal Total Changes CE - Cost Variance CE - Cost & Funding Summary Then Year $M RDT&E Proc 1375.7 10049.0 MILCON -- Total 11424.7 -9.9 --+205.7 +109.3 --+305.1 -176.2 +1385.4 +109.9 +47.2 +1315.4 --11.6 +2670.1 --------- -186.1 +1385.4 +109.9 +252.9 +1424.7 --11.6 +2975.2 +1.3 ----3.4 ---2.1 +303.0 1678.7 1678.7 +113.6 -308.3 +19.2 -8.2 +21.3 -+21.9 -140.5 +2529.6 12578.6 12578.6 ------------ +114.9 -308.3 +19.2 -8.2 +17.9 -+21.9 -142.6 +2832.6 14257.3 14257.3 UNCLASSIFIED 21 MH-60R SAR Baseline (Prod Est) Previous Changes Economic Quantity Schedule Engineering Estimating Other Support Subtotal Current Changes Economic Quantity Schedule Engineering Estimating Other Support Subtotal Total Changes CE - Cost Variance CE - Cost & Funding December 31, 2011 SAR Summary Base Year 2006 $M RDT&E Proc 1519.0 9108.0 MILCON -- Total 10627.0 ---+187.0 +115.3 --+302.3 -+1152.2 +48.2 +40.6 +1154.3 --21.7 +2373.6 --------- -+1152.2 +48.2 +227.6 +1269.6 --21.7 +2675.9 -----3.1 ---3.1 +299.2 1818.2 1818.2 --251.7 +4.4 -7.4 +19.2 -+17.5 -218.0 +2155.6 11263.6 11263.6 ------------ --251.7 +4.4 -7.4 +16.1 -+17.5 -221.1 +2454.8 13081.8 13081.8 Previous Estimate: December 2010 UNCLASSIFIED 22 MH-60R December 31, 2011 SAR RDT&E Current Change Explanations Revised escalation indices. (Economic) Adjustment for current and prior escalation. (Estimating) Revised estimate for the refinement of the Automatic Radar Periscope Detection and Discrimination (ARPDD). (Estimating) Revised estimate to reflect actuals. (Estimating) RDT&E Subtotal Procurement $M Base Then Year Year N/A +1.3 -1.0 -1.1 -1.5 -1.6 -0.6 -3.1 -0.7 -2.1 $M Current Change Explanations Revised escalation indices. (Economic) Quantity variance resulting from a decrease of 9 aircraft from 298 to 289. (Quantity) Schedule variance resulting from reduction of 5 aircraft in both FY 2013 and FY 2014 and addition of 1 aircraft in FY 2016. (Schedule) Decrease in engineering costs due to the incorporation of Sikorsky Airframe Engineering Change Proposals (ECPs). (Engineering) Adjustment for current and prior escalation. (Estimating) Increase in revised cost estimate for Sikorsky Airframe follow-on multi-year contract costs due to labor rates adjustment for going below Minimum Sustaining Rate (MSR). (Estimating) Increase in revised cost estimate for Lockheed Martin Mission Systems and Common Cockpit contract costs due to labor rates adjustment for going below MSR. (Estimating) Decrease in revised cost estimate for Government Furnished Equipment (GFE) requirements and prior year actuals. (Estimating) Decrease in revised cost estimate for refinement of Engineering Change Order (ECO) estimate. (Estimating) Decrease in revised cost estimate for reduction of Ancillary Airborne Low Frequency Sonar (ALFS) quantities from 213 to 206 total and re-phasing. (Estimating) Decrease in revised estimate for Non-Recurring Engineering (NRE) associated with ARPDD, ALFS and other NRE. (Estimating) Adjustment for current and prior escalation. (Support) Increase in other Support for Littoral Combat Ship aircraft Peculiar Ground Support Equipment. (Support) Increase in Initial Spares due to refined cost estimates. (Support) Procurement Subtotal UNCLASSIFIED Base Year N/A -251.7 Then Year +113.6 -308.3 +4.4 +19.2 -7.4 -8.2 -32.6 -36.5 +38.5 +47.5 +68.0 +79.5 -1.0 -2.8 -1.4 -1.5 -25.1 -30.7 -27.2 -34.2 -5.8 -6.7 +15.9 +20.1 +7.4 -218.0 +8.5 -140.5 23 MH-60R December 31, 2011 SAR Contracts Appropriation: Procurement Contract Name Contractor Contractor Location Contract Number, Type Award Date Definitization Date Initial Contract Price ($M) Target Ceiling Qty 1065.0 N/A 139 LM MS2 MY Production Lots (5-9) Lockheed Martin Mission Systems & Sensors (LM MS2) Owego, NY 13827-3998 N00019-06-C-0098, FFP August 16, 2007 August 16, 2007 Current Contract Price ($M) Target Ceiling Qty 1101.0 N/A 131 Estimated Price At Completion ($M) Contractor Program Manager 1101.1 1101.1 Cost And Schedule Variance Explanations Cost and Schedule variance reporting is not required on this FFP contract. Contract Comments The difference between the initial contract price target and the current contract price target is due to a contract modification awarded in December 2009 for additional scope for procurement of the Common Cockpit (CC) for FY 2010 and FY 2011. UNCLASSIFIED 24 MH-60R December 31, 2011 SAR Appropriation: RDT&E LM MS2 Automatic Radar Periscope Detection and Discrimination (ARPDD) SDD Contract Name Contractor Lockheed Martin Mission Systems & Sensors (LM MS2) Contractor Location 1801 State Route 17C Owego, NY 13827-3998 Contract Number, Type N00019-08-C-0005, CPIF Award Date June 26, 2008 Definitization Date June 26, 2008 Initial Contract Price ($M) Target Ceiling Qty 144.0 N/A N/A Current Contract Price ($M) Target Ceiling Qty 146.4 N/A N/A Variance Cumulative Variances To Date (1/29/2012) Previous Cumulative Variances Net Change Estimated Price At Completion ($M) Contractor Program Manager 147.6 148.9 Cost Variance Schedule Variance -1.9 -4.0 +2.1 -0.5 -0.8 +0.3 Cost And Schedule Variance Explanations The favorable net change in the cost variance is due to cost and schedule efficiency in the area of Integration and Test. The favorable net change in the schedule variance is due to LM MS2's ability to execute key program tasks and milestones leading up to contractor and Integrated test on or near their original baselined dates. Contract Comments This contract is more than 90% complete; therefore, this is the final report for this contract. The difference between the initial contract price target and the current contract price target is due to the addition of two wiring kits required to support integrated and operational testing for the Automatic Radar Periscope Detection and Discrimination (ARPDD) System Development and Demonstration(SDD) program. UNCLASSIFIED 25 MH-60R December 31, 2011 SAR Appropriation: Procurement Contract Name Contractor Contractor Location L3 Common Data Link (CDL) L3 Communications Corporation 640 N 2200 W, P.O. Box 16850 Salt Lake City, UT 84116-0850 N00019-09-C-0059, FPIF June 12, 2009 June 12, 2009 Contract Number, Type Award Date Definitization Date Initial Contract Price ($M) Target Ceiling Qty 59.8 65.0 N/A Current Contract Price ($M) Target Ceiling Qty 141.9 141.9 N/A Variance Cumulative Variances To Date (1/27/2012) Previous Cumulative Variances Net Change Estimated Price At Completion ($M) Contractor Program Manager 141.9 141.9 Cost Variance Schedule Variance -20.0 -8.0 -12.0 -0.3 -1.2 +0.9 Cost And Schedule Variance Explanations The unfavorable net change in the cost variance is due to Integration Assembly. Cost inefficiencies are a result of support of Government First Article Inspection and Test (GFAIT). Actual cost has exceeded the budget at complete by $15.2M. This is a FPIF contract and the Government overrun share ratio was capped at $1.2M. The Government will not accrue any additional cost from the overruns. The favorable net change in the schedule variance is due to additional staffing added to the program to overcome delays in First Article Delivery and production delays. Contract Comments This contract is more than 90% complete; therefore, this is the final report for this contract. The difference between the initial contract price target and the current contract price target is due to awarding an option for procurement of additional SRQ-4 Common Data Link (CDL) components and spares. UNCLASSIFIED 26 MH-60R Appropriation: Procurement Contract Name Contractor Contractor Location Contract Number, Type Award Date Definitization Date Initial Contract Price ($M) Target Ceiling Qty 81.1 N/A 23 December 31, 2011 SAR Raytheon Integrated Defense Systems ALFS Lots 7 - 8 Raytheon Integrated Defense Systems Portsmouth, RI 02871-1087 N00019-09-C-0096, FFP September 22, 2009 September 22, 2009 Current Contract Price ($M) Target Ceiling Qty 142.1 N/A 41 Estimated Price At Completion ($M) Contractor Program Manager 142.1 142.1 Cost And Schedule Variance Explanations Cost and Schedule variance reporting is not required on this FFP contract. Contract Comments The difference between the initial contract price target and the current contract price target is due to a contract modification awarded in March 2010 for additional scope for procurement of 18 Lot 8 Airborne Low Frequency Sonar (ALFS) systems and 2 Sonar Transmitter/Receivers (ST/R). UNCLASSIFIED 27 MH-60R Appropriation: Procurement Contract Name Contractor Contractor Location Contract Number, Type Award Date Definitization Date Initial Contract Price ($M) Target Ceiling Qty 81.7 N/A 24 December 31, 2011 SAR Raytheon Integrated Defense Systems ALFS Lot 9 Raytheon Integrated Defense Systems Portsmouth, RI 02871-1087 N00019-11-C-0077, FFP September 27, 2011 September 27, 2011 Current Contract Price ($M) Target Ceiling Qty 162.5 N/A 49 Estimated Price At Completion ($M) Contractor Program Manager 162.5 162.5 Cost And Schedule Variance Explanations Cost and Schedule variance reporting is not required on this FFP contract. Contract Comments The difference between the initial contract price target and the current contract price target is due to a contract modification awarded in December 2011 for additional scope for procurement of the 25 Royal Australian Navy (RAN) Airborne Low Frequency Sonar (ALFS) systems. This is the first time this contract is being reported. UNCLASSIFIED 28 MH-60R Appropriation: Procurement Contract Name Contractor Contractor Location Contract Number, Type Award Date Definitization Date Initial Contract Price ($M) Target Ceiling Qty 2090.0 N/A 139 December 31, 2011 SAR SAC MY Production Lots (5-9) Sikorsky Aircraft Corporation (SAC) Stratford, CT 06614-1378 W58RGZ-08-C-0003, FFP December 12, 2007 December 12, 2007 Current Contract Price ($M) Target Ceiling Qty 1979.9 N/A 131 Estimated Price At Completion ($M) Contractor Program Manager 1979.9 1979.9 Cost And Schedule Variance Explanations Cost and Schedule variance reporting is not required on this FFP contract. Contract Comments The difference between the initial contract price target and the current contract price target is due to the reduction of aircraft quantities. UNCLASSIFIED 29 MH-60R December 31, 2011 SAR Deliveries and Expenditures Deliveries To Date Plan To Date Development Production Total Program Quantities Delivered Total Acquisition Cost Expenditures To Date Percent Expended Total Funding Years Actual To Date 2 120 122 Total Quantity 2 120 122 Expenditures and Appropriations (TY $M) 14257.3 Years Appropriated 6971.0 Percent Years Appropriated 48.89% Appropriated to Date 28 Percent Appropriated 2 289 291 Percent Delivered 100.00% 41.52% 41.92% 23 82.14% 9753.3 68.41% Deliveries and expenditures are current as of February 29, 2012. UNCLASSIFIED 30 MH-60R December 31, 2011 SAR Operating and Support Cost Assumptions And Ground Rules Estimated Duration = Fiscal Year (FY) 2006 to 2038 MH-60R Fatigue Life = 10,000 Hours or approximately 22 years Aircraft Attrition Rate = 0.5% of Total Aircraft Inventory (TAI) per Year Aircraft Pipeline Rate = 10% of TAI per Year Total Procured MH-60R Aircraft = 291 (289 + 2 Research, Development, Test, and Evaluation (RDT&E)) Aircraft per Fleet Squadron = 12 Aircraft per Fleet Replacement Squadron = 13 Average Flight Hours per Month per Aircraft = 37.9 Total Operating Aircraft Years = 4,707 Date of Estimate: February 2012 Source: NAVAIR 4.2 Cost Department; Operating & Sustainment Division Cost estimate updated to reflect a reduction in the Primary Authorized Aircraft (PAA) and flight hours from the Milestone III estimate from 500 flight hours per year to 353 flight hours per year. Maintenance Costs consisting of Aviation Depot Level Repairable (AVDLR) and Consumables are now estimated using a bottoms up model, utilizing both historical costs and reliability performance to date for the MH-60R which includes the cost savings of new I-level capabilities, instead of the observed historical cost ratios from other similar H-60s. In addition, a MH-60R specific manning document and sundown plan is now being utilized instead of the legacy manning documents for other H-60 platforms. The Base Year total was calculated multiplying the dollar per aircraft cost by the total number of aircraft years of the O&S cycle. A phased approach estimate includes the ramp-up of aircraft as they are introduced to the fleet through the retirement of MH-60R aircraft from service with a total aircraft procurement of 291. The antecedent system is the SH-60B/F aircraft. All costs are from the FY 2011 Navy Visibility and Management of Operating and Support Costs (VAMOSC) Aviation Type Model Series Report (ATMSR) database (data from 2009 through 2011) and the FY 2011 Aircraft Program Data File (APDF) Primary Authorized Aircraft (PAA). (6.0) Indirect Support is a function of Unit-Level Manpower costs. Legacy systems have experienced and continue to experience service life adjustments and system modifications that make the compilation of Total O&S cost by assuming a static service life (e.g. 25 years) not credible. In addition, the capture of Operating and Support (O&S) data in available reporting systems has changed significantly over time. VAMOSC (Visibility and Management of Operating and Support Costs), the Navy's official system for collecting and reporting O&S cost, provides cost from 1997 - present. The cost data for platforms in existence prior to 1997 is either unavailable or incomplete. In summary, sufficient historical data and resources do not exist to create a comparable, credible Total O&S cost. Rounding the Total Unitized Cost to $5.63M and then proceeding to multiply by the total operating years of 4,707 will equal $26,500M for Total O&S Base Year Cost. This reflects a $4 Million Rounding Error in the Total O&S Base Year Cost. Reporting was changed from the 1992 Cost Analysis Improvement Group (CAIG O&S) format to the 2007 Cost Assessment and Program Evaluation (CAPE) format. UNCLASSIFIED 31 MH-60R December 31, 2011 SAR Cost Element Costs BY2006 $M MH-60R Average Annual Cost per Aircraft Unit-Level Manpower Unit Operations Maintenance Sustaining Support Continuing System Improvements Indirect Support Other Total Unitized Cost (Base Year 2006 $) Total O&S Costs $M Base Year Then Year SH-60B/F Average Annual Cost per Aircraft 1.92 0.22 2.43 0.09 0.23 0.75 0.00 5.64 MH-60R 1.86 0.24 2.07 0.10 0.22 0.47 0.00 4.96 SH-60B/F 26504.0 38635.0 --- As defined by the Cost Assessment and Program Evaluation Department Operating and Support (O&S) CostEstimating Guide of October 2007, disposal costs are not part of O&S. It is not currently estimated for this program. UNCLASSIFIED 32
