X____________________ . The FDC (Federal Department of Candy) is investigating
advertisement
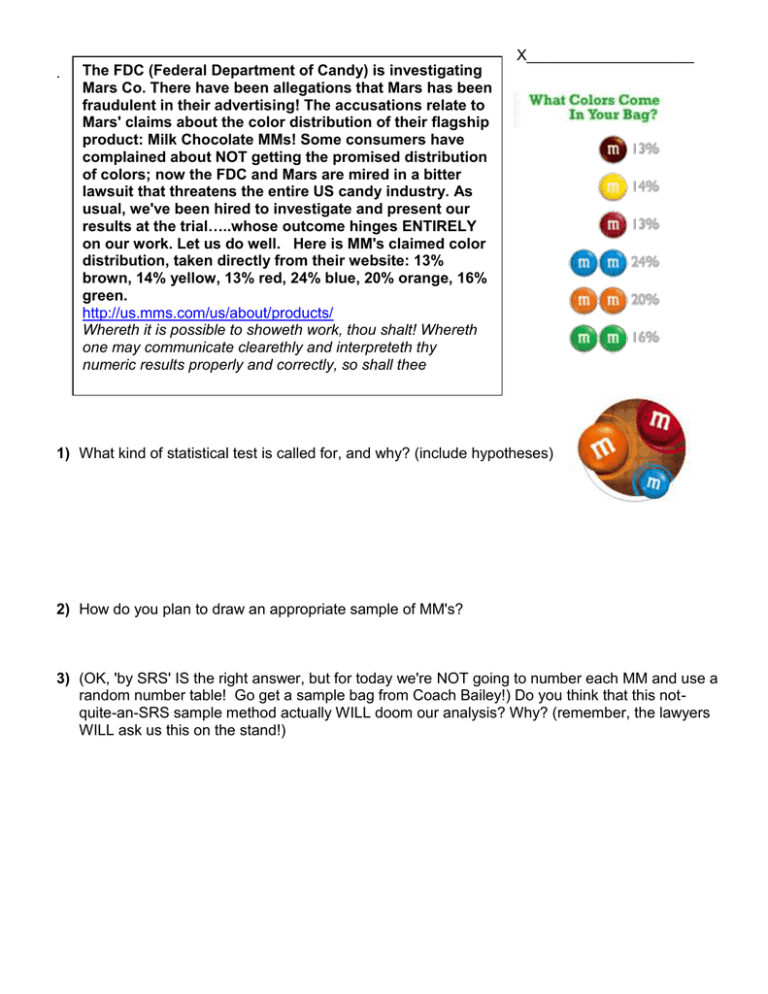
X____________________ . The FDC (Federal Department of Candy) is investigating Mars Co. There have been allegations that Mars has been fraudulent in their advertising! The accusations relate to Mars' claims about the color distribution of their flagship product: Milk Chocolate MMs! Some consumers have complained about NOT getting the promised distribution of colors; now the FDC and Mars are mired in a bitter lawsuit that threatens the entire US candy industry. As usual, we've been hired to investigate and present our results at the trial…..whose outcome hinges ENTIRELY on our work. Let us do well. Here is MM's claimed color distribution, taken directly from their website: 13% brown, 14% yellow, 13% red, 24% blue, 20% orange, 16% green. http://us.mms.com/us/about/products/ Whereth it is possible to showeth work, thou shalt! Whereth one may communicate clearethly and interpreteth thy numeric results properly and correctly, so shall thee 1) What kind of statistical test is called for, and why? (include hypotheses) 2) How do you plan to draw an appropriate sample of MM's? 3) (OK, 'by SRS' IS the right answer, but for today we're NOT going to number each MM and use a random number table! Go get a sample bag from Coach Bailey!) Do you think that this notquite-an-SRS sample method actually WILL doom our analysis? Why? (remember, the lawyers WILL ask us this on the stand!) 4) Sample Data Color Observed Count Expected Count (O-E)^2 E 5) X^2 = ________________ df = __________________ p-value = __________________ SUMS (now, dispose of your data in an appropriate way. Candy is NOT allowed in the courtroom) 6) Have all appropriate assumptions & conditions been met for X^2 analysis? Explain each, in language that lawyers (who are NOT necessarily statistically knowledgeable!) will understand. Are there any cautions in interpreting our results/conclusions? 7) What will be your testimony before the court? (i.e, your conclusions) 8) Your thoughts on how to make this lab a better learning experience:

