Survey of Durum Production Practices, 2004 Summary
advertisement
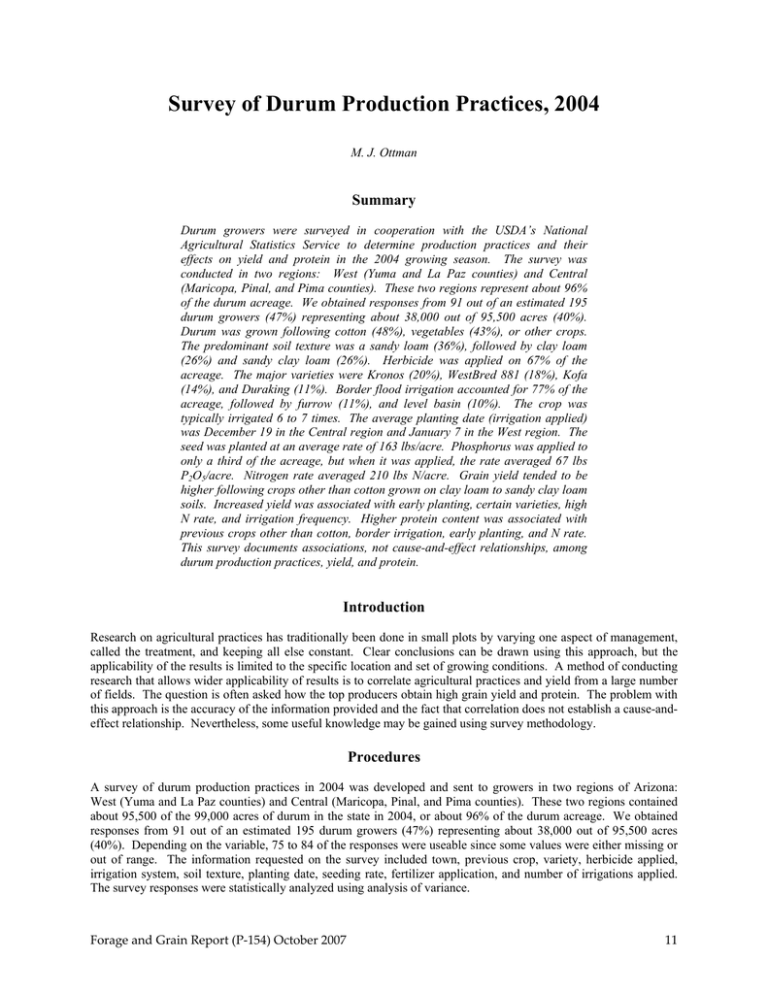
Survey of Durum Production Practices, 2004 M. J. Ottman Summary Durum growers were surveyed in cooperation with the USDA’s National Agricultural Statistics Service to determine production practices and their effects on yield and protein in the 2004 growing season. The survey was conducted in two regions: West (Yuma and La Paz counties) and Central (Maricopa, Pinal, and Pima counties). These two regions represent about 96% of the durum acreage. We obtained responses from 91 out of an estimated 195 durum growers (47%) representing about 38,000 out of 95,500 acres (40%). Durum was grown following cotton (48%), vegetables (43%), or other crops. The predominant soil texture was a sandy loam (36%), followed by clay loam (26%) and sandy clay loam (26%). Herbicide was applied on 67% of the acreage. The major varieties were Kronos (20%), WestBred 881 (18%), Kofa (14%), and Duraking (11%). Border flood irrigation accounted for 77% of the acreage, followed by furrow (11%), and level basin (10%). The crop was typically irrigated 6 to 7 times. The average planting date (irrigation applied) was December 19 in the Central region and January 7 in the West region. The seed was planted at an average rate of 163 lbs/acre. Phosphorus was applied to only a third of the acreage, but when it was applied, the rate averaged 67 lbs P2O5/acre. Nitrogen rate averaged 210 lbs N/acre. Grain yield tended to be higher following crops other than cotton grown on clay loam to sandy clay loam soils. Increased yield was associated with early planting, certain varieties, high N rate, and irrigation frequency. Higher protein content was associated with previous crops other than cotton, border irrigation, early planting, and N rate. This survey documents associations, not cause-and-effect relationships, among durum production practices, yield, and protein. Introduction Research on agricultural practices has traditionally been done in small plots by varying one aspect of management, called the treatment, and keeping all else constant. Clear conclusions can be drawn using this approach, but the applicability of the results is limited to the specific location and set of growing conditions. A method of conducting research that allows wider applicability of results is to correlate agricultural practices and yield from a large number of fields. The question is often asked how the top producers obtain high grain yield and protein. The problem with this approach is the accuracy of the information provided and the fact that correlation does not establish a cause-andeffect relationship. Nevertheless, some useful knowledge may be gained using survey methodology. Procedures A survey of durum production practices in 2004 was developed and sent to growers in two regions of Arizona: West (Yuma and La Paz counties) and Central (Maricopa, Pinal, and Pima counties). These two regions contained about 95,500 of the 99,000 acres of durum in the state in 2004, or about 96% of the durum acreage. We obtained responses from 91 out of an estimated 195 durum growers (47%) representing about 38,000 out of 95,500 acres (40%). Depending on the variable, 75 to 84 of the responses were useable since some values were either missing or out of range. The information requested on the survey included town, previous crop, variety, herbicide applied, irrigation system, soil texture, planting date, seeding rate, fertilizer application, and number of irrigations applied. The survey responses were statistically analyzed using analysis of variance. Forage and Grain Report (P-154) October 2007 11 Results and Discussion Durum acreage in 2004 was roughly split between the West (56%) and Central (44%) regions, and grain yield and protein in these regions was not significantly different (Table 1). The county with the greatest percentage of the acreage was Yuma (36%) followed by Pinal (22%) and Maricopa (18%). Grain yield was highest in Yuma and Pinal Counties, and grain protein was lowest in Maricopa County. About half (48%) of the durum was planted after cotton and the other half after vegetables and other crops. When the previous crop was cotton, durum yield and protein were lower compared to other previous crops. The predominant varieties in terms of percentage of acreage were Kronos (20%), WestBred 881 (18%), Kofa (14%), and Duraking (11%). Many varieties were grown in both regions, but some such as Kofa and Alamo were only grown in the West region and others such as Ocotillo and Crown were only grown in the Central region. The highest yielding varieties were Duraking in the West region and Mohawk in the Central region. We were not able to detect differences in grain protein concentration among varieties. Herbicide was usually applied to most of the acreage in the West region, whereas only about half of the acreage in the Central region received a herbicide application. Herbicide application did not affect yield or protein. The predominant irrigation system is border flood (77%) followed by furrow mainly in the Central region (11%) and level basin mainly in the West region (10%). Some of the respondents with level basin irrigation systems may have listed their irrigation system as border flood. We found no relationship between irrigation system and grain yield, but higher grain protein was associated with border flood than furrow or level basin irrigation. Durum was grown predominantly on sandy loam soil (36%) followed by clay loam (26%) and sandy clay loam (26%) soil. Most of the clay loam soil was in the West region. Grain yield was lower on sandy loam soil compared with the heavier soil textures, clay loam and sandy clay loam. The average planting date was January 7 in the West region and December 19 in the Central region. February plantings were associated with lower grain yield in the West region. In the Central region, higher protein was observed in the December than January plantings. The average seeding rate was 163 lbs seed/acre. No differences in yield or protein could be attributed to seeding rate. The average nitrogen rate was 210 lbs N/acre. In the West region, the highest protein content was associated with nitrogen rates between 100 – 199 lbs N/acre. In the Central region, the highest yields were associated with nitrogen rates between 300 – 499 lbs N/acre. The response of the durum crop to nitrogen fertilizer depends on several factors that were not included in this survey such as manure application and soil nitrogen content. Only about a third of the durum acreage received P fertilizer, but a higher percentage of the acreage in the Central region received P fertilizer than in the West region presumably due to adequate soil P in the West from vegetable production. When P fertilizer was applied, the average phosphorus rate was 67 lbs P2O5/acre. Application of P fertilizer in the Central region was associated with slightly higher grain yield, but again, response to P fertilizer is also influenced by other factors such as manure and soil P. The average number of irrigations applied was 6.5. The number of irrigations applied was associated with yield in both regions. In the West, grain yield increased as number of irrigations increased to seven, but decreased if more than seven irrigations were applied. This trend may not be directly affected by irrigation number, but by the fact that fewer irrigations are applied to later plantings and more irrigations are applied to lighter soils, both of which are associated with lower yields. In the Central region, increased irrigation frequency is associated with higher yields. This survey has shown that there are some associations between the various durum production practices and grain yield and protein, but these associations do not imply a cause-and-effect relationship. Side by side comparisons are the best way to evaluate the direct effect of varieties, fertilizer rates, or irrigation practices. Nevertheless, there Forage and Grain Report (P-154) October 2007 12 appears to be an association between higher yields and previous crops other than cotton, certain varieties, clay loam or sandy clay loam soil texture, early planting, high N rate, and irrigation number. Grain protein was associated with previous crops other than cotton, border flood irrigation, early planting, and N rate. Acknowledgements I wish to thank the staff at the National Agricultural Statistics Service for designing and conducting the survey and collating the results. I also wish to thank Larry Aleamoni, Head of the Special Education Department at the University of Arizona, for his helpful suggestions on how to analyze the data. This project was funded by the Arizona Grain Research and Promotion Council. Forage and Grain Report (P-154) October 2007 13 Table 1. Number of survey respondents (N), grain yield, grain protein, and percentage of acres represented by various durum production practices in Arizona. West (Yuma and La Paz Co.) N Yield Protein Acres lbs/a % % Region West Central Significance County Yuma Pinal Maricopa LaPaz Pima Significance Previous crop Cotton Vegetables Leaf lettuce Alfalfa Fallow Head lettuce Corn Durum Significance Variety Kronos WPB881 Kofa Duraking Alamo Ocotillo Crown Mohawk Orita Tacna Matt Platinum Experimental Significance Central (Maricopa, Pinal, and Pima Co.) N Yield Protein Acres lbs/a % % N All (West and Central) Yield Protein Acres lbs/a % % 43 --- 6022 ----- 14.0 ----- 56 --- --41 --5834 --- --13.6 --- --44 43 41 6022 5834 NS 14.0 13.6 NS 56 44 36 ----7 --- 6133 ----5447 ----- 14.0 ----14.0 ----- 43 ----13 --- --22 18 --1 --6008 5645 --5400 --- --14.0 13.3 --12.5 --- --23 15 --6 36 22 18 7 1 6133 6008 5645 5447 5400 + 14.0 14.0 13.3 14.0 12.5 + 43 23 15 13 6 7 20 6 4 --4 ----- 5955 6038 5886 6100 --6825 ----NS 13.6 13.7 14.6 14.8 --14.4 ----NS 9 31 9 3 --3 ----- 36 ----1 2 --1 1 5768 ----7300 6000 --7400 4850 NS 13.6 ----13.6 13.5 --16.0 14.0 NS 40 ----0 3 --1 1 43 20 6 5 2 4 1 1 5798 6038 5886 6340 6000 6825 7400 4850 + 13.6 13.7 14.6 14.6 13.5 14.4 16.0 14.0 + 48 31 9 3 3 3 1 1 11 8 17 6 10 ----3 1 1 --1 1 6225 5467 6550 7000 5762 ----5600 ----------* 13.7 14.3 14.0 15.5 14.1 ----------------NS 12 10 14 6 9 ----3 0.4 0.8 --0.3 0.2 12 3 --4 --11 10 6 7 --1 ----- 5708 4450 --5867 --5443 5663 7023 6657 --------* 13.8 12.8 --13.0 --13.9 13.2 14.5 13.6 --------NS 8 8 --6 --7 7 4 4 --0.3 ----- 23 11 17 10 10 11 10 9 8 1 1 1 1 5907 5060 6550 6320 5762 5443 5663 6548 6657 --------** 13.8 13.7 14.0 14.7 14.1 13.9 13.2 14.5 13.6 --------NS 20 18 14 11 9 7 7 7 5 0.8 0.3 0.3 0.2 Forage and Grain Report (P-154) October 2007 14 Table 1 (Con’d). Number of survey respondents, grain yield, grain protein, and percentage of acres represented by various durum production practices in Arizona. West (Yuma and La Paz Co.) N Yield Protein Acres lbs/a % % Herbicide applied No Yes Significance Irrigation system Border Furrow Level basin Drip Significance Soil texture Sandy loam Clay loam Sandy clay loam Loam Clay Silt loam Sand Silty clay Significance Planting date December January February Significance Seeding rate (lbs/a) 120-135 140-155 160-175 180-229 Significance Nitrogen rate (lbs N/a) 0-99 100-199 200-299 300-499 Significance Central (Maricopa, Pinal, and Pima Co.) N Yield Protein Acres lbs/a % % N All (West and Central) Yield Protein Acres lbs/a % % 7 36 5688 6086 NS 14.4 13.9 NS 9 47 22 19 5872 5789 NS 13.5 13.8 NS 24 19 29 55 5828 5984 NS 13.7 13.8 NS 33 67 35 --7 1 6034 --5982 5850 NS 14.1 --13.4 14.0 NS 46 --9 1 25 14 2 --- 5879 5758 5795 --NS 13.9 13.3 12.9 --+ 31 11 1 --- 60 14 9 1 5970 5758 5940 5850 NS 14.0 13.3 13.3 14.0 * 77 11 10 1 12 16 5963 6123 13.9 14.0 18 21 20 7 5559 6156 13.5 14.0 18 5 32 23 5711 6133 13.7 14.0 36 26 9 3 1 1 --1 6196 5845 5000 5500 --5600 NS 13.9 13.9 14.5 14.0 --13.3 NS 10 5 0 2 --1 10 1 1 --1 --- 6356 5500 5500 --4850 --NS 13.5 13.5 13.4 --14.0 --NS 15 1 2 --1 --- 19 4 2 1 1 1 6280 5759 5250 5500 4850 5600 * 13.7 13.8 13.8 14.0 14.0 13.3 NS 26 6 2 2 1 1 18 17 7 6101 6148 5514 ** 14.2 13.9 13.3 NS 20 28 11 29 9 --- 5904 5678 --NS 13.8 13.0 --+ 28 14 --- 47 26 7 5980 5985 5514 * 13.9 13.6 13.3 NS 48 42 11 9 12 11 9 6102 6044 6138 5774 NS 14.3 13.6 13.7 14.3 NS 8 20 14 18 0 9 16 12 --6072 5912 5590 NS 14.0 13.6 13.6 13.6 NS 0 10 15 16 9 21 27 21 6102 6056 6004 5669 NS 14.3 13.6 13.7 13.9 NS 8 29 29 34 3 9 25 6 5671 5940 6098 6002 NS 13.5 14.7 13.7 14.2 + 3 6 36 11 7 11 15 8 5866 5582 5668 6463 * 13.8 13.5 13.8 13.4 NS 10 7 14 13 10 20 40 14 5807 5743 5937 6265 NS 13.7 14.0 13.8 13.7 NS 13 14 50 23 Forage and Grain Report (P-154) October 2007 15 Table 1 (Con’d). Number of survey respondents, grain yield, grain protein, and percentage of acres represented by various durum production practices in Arizona. West (Yuma and La Paz Co.) N Yield Protein Acres lbs/a % % Phosphorus applied No Yes Significance Number of irrigations <6 6 7 >7 Significance All Central (Maricopa, Pinal, and Pima Co.) N Yield Protein Acres lbs/a % % N All (West and Central) Yield Protein Acres lbs/a % % 33 10 6037 5972 NS 13.9 14.1 NS 44 12 19 22 5751 5906 * 13.7 13.6 NS 21 23 52 32 5932 5926 NS 13.8 13.8 NS 65 35 14 13 8 8 5912 6215 6441 5479 * 13.8 13.9 14.2 14.1 NS 17 18 11 14 6 14 8 10 5951 5343 5885 6400 * 13.4 13.6 13.7 13.8 NS 12 14 6 8 20 27 16 18 5924 5763 6163 5991 * 13.6 13.7 13.9 13.9 NS 28 32 17 22 43 6022 14.0 56 41 5834 13.6 44 84 5930 13.8 100 Significance: Statistical significance or probability that differences observed are due to chance. NS = not significant at the 10% probability level, + = significant at the 10% probability level, * = significant at the 5% probability level, and ** = significant at the 1% probability level. Forage and Grain Report (P-154) October 2007 16
