2008 Assessment in the Major Report B.S. in Science Education
advertisement
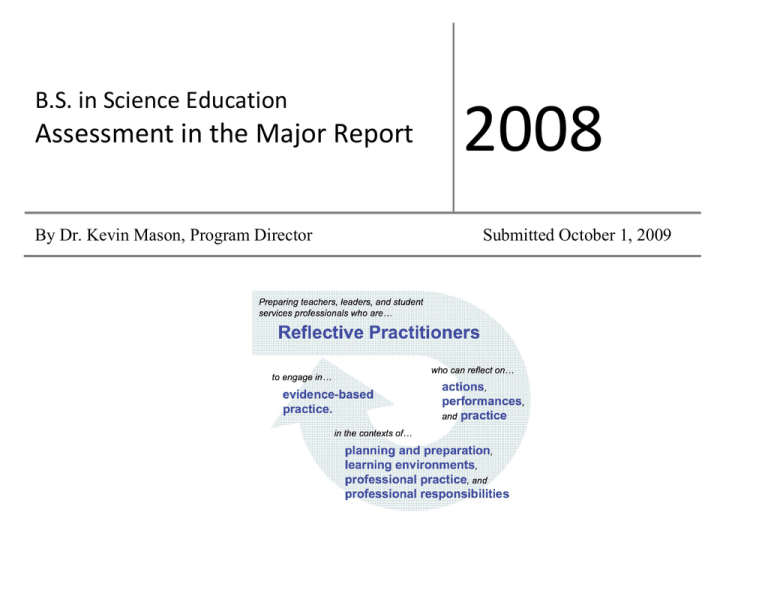
B.S. in Science Education Assessment in the Major Report By Dr. Kevin Mason, Program Director 2008 Submitted October 1, 2009 Table of Contents Introduction ..............................................................................................................................................................................................................2 PRAXIS I: Pre-Professional Skills Test .................................................................................................................................................................2 PRAXIS II: Content Test Summary ........................................................................................................................................................................3 Benchmark Interview Ratings..................................................................................................................................................................................4 Reflections ...............................................................................................................................................................................................................7 Pre-Student Teaching Performance .........................................................................................................................................................................8 Student Teaching Performance Ratings ...................................................................................................................................................................9 Educational Benchmarking Inventory (EBI) ...........................................................................................................................................................9 Alumni Follow-up Survey .......................................................................................................................................................................................9 Communicating Assessment Data with Constituencies...........................................................................................................................................9 Utilization of Assessment Data to Improve Courses and the Program ....................................................................................................................9 Science Education AIM Report 2008 Page 1 Introduction The BS in Science Education officially began in the fall of 2009. Prior to the BS in Science Education, the science education program existed as a concentration within the BS in Applied Science program. The Wisconsin Department of Public Instruction (DPI) approved the broadfield science certification at UW-Stout in 2004. The first course in science education was taught in the spring of 2006. The University of WisconsinStout School of Education (SOE) has gathered assessment data from fall semester 2003 through December 2008. In the School of Education, data is gathered from several sources to inform unit and program decisions. Data in this report is used to develop program goals, inform curriculum changes, and enhance course delivery in order to improve teacher education candidate learning. This report contains data from the PRAXIS I: PreProfessional Skills Test, PRAXIS II: Content Test, Student Artifact Reflections, Candidate Dispositions, PreStudent Teaching and Student Teacher Performances, Benchmark Interviews, and the Educational Benchmarking Inventory (EBI). This report also describes how assessment data is used to set programmatic goals, improve the program, program curriculum, and delivery of courses. PRAXIS I: Pre­Professional Skills Test The Pre-professional Skills Test (PPST) is one indicator that the program uses to assure its graduates’ general education skill set. It is a critical benchmark exam that students must pass prior to full acceptance to the program. The table below highlights the pass rates across test sections (Math, Reading, and Writing). It should be noted that all candidates are required to pass the PPST to be admitted to the School of Education as part of Benchmark I so the pass rate is 100% upon Benchmark I approval. The sample size of science education students who took the PPST between 2006 and 2008 is six students. Nonetheless, the data shows that 100% of science education students have passed the math, reading, and writing portions of the PPST exam. This compares favorably with the data collected on school of education students. PPST Attempts and Pass Rates Teacher Education Program APSCI PPST Test Math Reading Writing Math SOE UG TOTALS 2006 # test attempts 1 1 1 2006 # (and %) passed 1 = 100% 1 = 100% 1 = 100% 204 Reading 280 Writing 296 148 = 72.5% 145 = 51.8% 161 = 54.4% 2007 # test attempts 4 4 3 226 243 257 2007 # (and %) passed 4 4 3 191 = 84.5% 184 = 75.7% 200 = 77.8% 2008 # test attempts 1 1 2 130 150 138 2008 # (and %) passed 1 (100%) 1 (100%) 2 (100%) 102 = 78.5% 119 = 79.3% 104 = 75.4% Science Education AIM Report 2008 Page 2 PRAXIS II: Content Test Summary Science education students are required to pass the Praxis II General Science Exam prior to student teaching. The number of examinees in the table below is equivalent to the number of attempts at the exam, which is equal to six attempts. The sample size of science education students who took the PRAXIS II General Science Exam in 2007 and 2008 is three students. One student attempted and failed the exam in 2007. The same student failed the exam three times in 2008 before eventually passing the exam in 2009. The other two students passed the exam on their first attempts in 2008. It should be noted that all candidates are required to pass the Praxis II to be admitted to student teaching as part of Benchmark II so the pass rate is 100% upon Benchmark II approval. Science Education Praxis Test Code – 10435 Science Education – from Datatel 2004* Number of Examinees: Highest Observed Score: Lowest Observed Score WI Score Need to Pass: Number with WI Passing Score Percent with WI Passing Score 2004 2005 2006 2007 2008 1 147 147 153 0/1 0% 2 173 142 154 1/2 50% * - scores from no-fault year – “grandfathered in” as passing Science Education AIM Report 2008 Page 3 Benchmark Interview Ratings Benchmark interview means are reported by benchmark level (I, II, and III) or each interview question. Benchmark I Interview Results Calender Year 2008 Question Explain personal and professional growth between your initial resume and updated resume. Explain your philosophy of education. Explain three personal characteristics that will make you an effective teacher. Describe yourself as a learner and how that will impact your future teaching. Describe experiences that have impacted your understanding of diversity and human relations and how these might aid you as you work with students and families Explain two subject matter/content artifacts and how these examples illustrate your understanding of the content you will be teaching Completed Alignment Summary Science Education AIM Report 2008 Response Unsatisfactory SCIED SP08 FA08 N=4 N=1 0 0% 0 0% Satisfactory Unsatisfactory Satisfactory Unsatisfactory Satisfactory Unsatisfactory Satisfactory 4 0 4 0 4 0 4 Unsatisfactory 0 Satisfactory 4 100% 1 100% 96 100% 37 100% Unsatisfactory 0 Satisfactory Unsatisfactory Satisfactory 4 100% 1 100% 96 100% 37 100% 0 0% 0 0% 0 0% 0 0% 4 100% 1 100% 96 100% 37 100% 100% 0% 100% 0% 100% 0% 100% SOE UNIT SP08 FA08 N=96 N=37 0 0% 0 0% 1 0 1 0 1 0 1 100% 0% 100% 0% 100% 0% 100% 96 0 96 0 96 0 96 100% 0% 100% 0% 100% 0% 100% 37 0 37 0 37 0 37 100% 0% 100% 0% 100% 0% 100% 0% 0 0% 0 0% 0 0% 0% 0 0% 0 0% 0 0% Page 4 Benchmark II Interview Results Calender Year 2008 Question Response Unsatisfactory Describe your Philosophy of Education and how Emerging it has evolved Basic n/a Unsatisfactory Emerging Describe what it means to be a "Reflective Practitioner" Basic n/a Unsatisfactory Describe the WI Teacher Standard and Domain Emerging you feel most competent in Basic n/a Unsatisfactory Describe the WI Teacher Standard and Domain Emerging you have experienced the greatest growth Basic n/a 0 1 0 0 0 0 1 0 0 0 1 0 0 1 0 0 SCIED SP08 FA08 N=1 N=2 0% 0 0% 100% 0 0% 0% 2 100% 0% 0 0% 0% 0 0% 0% 0 0% 100% 2 100% 0% 0 0% 0% 0 0% 0% 0 0% 100% 2 100% 0% 0 0% 0% 0 0% 100% 0 0% 0% 2 100% 0% 0 0% SOE UNIT SP08 FA08 N=71 N=76 1 1% 1 1% 25 35% 28 37% 44 62% 47 62% 1 1% 0 0% 0 0% 1 1% 23 32% 22 29% 47 66% 53 70% 1 1% 0 0% 0 0% 1 1% 21 30% 17 22% 49 69% 58 76% 1 1% 0 0% 0 0% 0 0% 24 34% 23 30% 45 63% 52 68% 2 3% 1 1% Reviewers choose 2 of the following; discuss portfolio evidence that: demonstrates your content knowledge demonstrates your knowledge of how children grow and learn demonstrates your ability to create instructional opportunities adapted to diverse learners demonstrates your ability to teach effectively demonstrates your ability to manage a classroom effectively, including organizing physical space, managing procedures and student behavior, and creating a culture of respect, rapport, and learning Science Education AIM Report 2008 Unsatisfactory Emerging Basic n/a Unsatisfactory Emerging Basic n/a Unsatisfactory Emerging Basic n/a Unsatisfactory Emerging Basic n/a Unsatisfactory Emerging Basic 0 1 0 0 0 0 0 1 0 0 0 1 0 0 0 1 0 1 0 n/a 0 0% 100% 0% 0% 0% 0% 0% 100% 0% 0% 0% 100% 0% 0% 0% 100% 0% 100% 0% 0 0 2 0 0 0 2 0 0 0 2 0 0 0 0 2 0 0 2 0% 0 0% 0% 100% 0% 0% 0% 100% 0% 0% 0% 100% 0% 0% 0% 0% 100% 0% 0% 100% 0 7 25 39 3 6 6 56 3 12 18 38 3 10 5 53 3 14 18 0% 10% 35% 55% 4% 8% 8% 79% 4% 17% 25% 54% 4% 14% 7% 75% 4% 20% 25% 0 9 25 42 0 5 10 61 0 15 27 34 0 4 6 66 0 13 21 0% 12% 33% 55% 0% 7% 13% 80% 0% 20% 36% 45% 0% 5% 8% 87% 0% 17% 28% 0% 36 51% 42 55% Page 5 demonstrates your ability to communicate effectively with students, parents, and colleagues demonstrates your ability to assess student learning demonstrates your professionalism, including ongoing professional development; fostering relationships with colleagues, families, and the community; and displaying ethical behavior expected of education professionals Unsatisfactory Emerging Basic n/a Unsatisfactory Emerging Basic n/a Unsatisfactory Emerging Basic 0 0 0 1 0 0 0 1 0 0 0 0% 0% 0% 100% 0% 0% 0% 100% 0% 0% 0% 0 0 0 2 0 0 0 2 0 0 0 n/a 1 100% 2 0% 0% 0% 100% 0% 0% 0% 100% 0% 0% 0% 0 3 9 59 0 13 16 42 0 11 18 0% 4% 13% 83% 0% 18% 23% 59% 0% 15% 25% 0 3 9 64 0 12 18 46 0 12 24 0% 4% 12% 84% 0% 16% 24% 61% 0% 16% 32% 100% 42 59% 40 53% As of 2008, we did not have any SCIED completers, therefore we have no Benchmark III data. Science Education AIM Report 2008 Page 6 Disposition of Teaching Summary at Benchmarks I, II and III Dispositions are a teacher licensure requirement dealing with the affective domain of teacher competencies. In the 2008-2009 school year, the disposition ratings were replaced with a new reporting system to identify students of concern in the area of dispositions, professionalism, and ethics. The samples size of one in 2005 and three in 2006 make interpreting the data over time more difficult. The sample size of 10 in 2007 provides greater insights into the dispositions of the science education students at that time. The 2007 data shows that science education students rate well in the categories of continuous learning, positive climate, reflective, thoughtful and responsive listener. The same data shows needs for improvement in attendance and preparedness. Disposition Category Attendance Preparedness Continuous Learning Positive Climate Reflective Thoughtful & Responsive Listener Cooperative / Collaborative Respectful Level BM I BM II BM III BM I BM II BM III BM I BM II BM III BM I BM II BM III BM I BM II BM III BM I BM II BM III BM I BM II BM III BM I BM II BM III Mean (N) 2005 3.00 (1) 2.00 (1) 2.00 (1) 2.00 (1) 2.00 (1) 2.00 (1) 2.00 (1) 2.00 (1) - Mean (N) 2006 3.67 (3) 2.33 (3) 3.00 (3) 2.67 (3) 2.33 (3) 2.67 (3) 3.00 (3) 2.67 (3) - Mean (N) 2007 2.70 (10) 3.00 (10) 3.50 (10) 3.40 (10) 3.50 (10) 3.50 (10) 3.30 (10) 3.30 (10) - Reflections The School of Education collects data on candidates’ ability to reflect as a key component of its conceptual framework. Because the Science Education program is new, we do not have spring 2008 data on candidate reflections. In fall 2008, the unit ceased use of a reflection rubric for rating candidate reflections. Instead, candidates are asked to reflect throughout their professional education coursework and as part of the benchmark interview process. Science Education AIM Report 2008 Page 7 Pre­Student Teaching Performance Student teachers are rated by their cooperating teachers and/or course instructors during pre-student teaching experiences in the program. There were four science education students who completed a pre-student teaching experience in 2008. The data below shows the pre-student teaching performance evaluations for these four students. The performance evaluation is arranged by the four domains of the Danielson Framework. The data shows that the four science education students who completed the pre-student teaching experience were strong in all four domains. While there were some responses of not applicable (NA), the pre-student teachers received scores of two on all items measured on the evaluation instrument. SCIED Frequencies Domain I: Planning and Preparation NA 1 2 1. Shows knowledge of content and pedagogy 0 0 4 2. Shows knowledge of student characteristics 0 0 4 3. Shows some understanding of instructional objectives 0 0 4 4. Shows some understanding of assessing student learning. 4 0 0 NA 0 2 1 0 0 2 4 2 Domain II: The Classroom Environment 1. 2. Displays respect and rapport Notices sensitivity to learning, cultural and racial differences in pupils 3. Aware of classroom procedures 0 0 4 4 Shows understanding of behavior management 2 0 2 5. Initiates interaction with students 0 0 4 Domain III: Instruction NA 1 2 1. Exhibits appropriate oral language usage 0 0 4 2. Exhibits appropriate written language usage 0 0 4 3. Exhibits appropriate voice projection 1 0 3 4. Recognizes the importance of student involvement 0 0 4 5. Provides appropriate feedback to student 0 0 4 6. Displays a sense of flexibility and responsiveness 7. Assists in classroom activities 0 1 NA 0 0 0 0 0 0 0 0 NA 0 0 1 0 0 0 0 0 0 0 0 1 4 3 2 4 4 4 4 4 4 4 4 2 Domain IV: Professional Responsibilities 1. 2. 3. 4. 5. 6. 7. 8. Demonstrates potential to grow & develop professionally Shows active interest & willingness to participate in classroom activities Has poise & confidence Indicates sense of responsibility and dependability. Exhibits good judgment, self-control & tact Shows interest in students Presents a professional appearance Displays a positive attitude Select Wisconsin Teacher Standards Science Education AIM Report 2008 Page 8 1. Knows the subjects they are teaching 2. 3. 6. 7. Knows how children grow Understands that children learn differently Communicates well Plans instruction based on knowledge of subject matter, students and curriculum goals 0 2 1 0 4 0 0 0 0 0 4 2 3 4 0 8. Knows how to test for student progress 4 0 0 Student Teaching Performance Ratings Student teachers are rated by their cooperating teachers during the student teaching capstone experience in the program. The Science Education program does not have data from student teacher performances. (Kevin, did you have any from 2008?) Educational Benchmarking Inventory (EBI) Science education students complete the EBI (Scale= 1-7 with 1= not at all, 4= moderately and 7= extremely) at the conclusion of their student teaching experience. The Science Education program does not yet have data from EBI surveys of exiting student teachers. Alumni Follow­up Survey The Science Education program does not yet have data from alumni follow-up studies conducted by the BPA office. Communicating Assessment Data with Constituencies Data will be communicated to content and core professional education faculty members through informal and formal means. Program faculty meet during scheduled discipline area work group meetings (DAWG) designed to support ongoing program improvement. In addition, the AIM findings will be shared with members of the science education advisory board, which includes science content faculty, school of education faculty, and local K-12 teachers. Action plans resulting in desired change will become the artifacts resulting from work group meetings. Utilization of Assessment Data to Improve Courses and the Program Although the data available on the performance of science education students has been limited by the size and age of the science education program, there are several key areas that are being addressed and improved. First, it was determined that one out of three students had difficulty passing the PRAXIS II General Science Exam. Preparation materials for the PRAXIS II General Science Exam have been purchased and are now available in the Library Learning Center. In addition, the science courses in the curriculum of the science education program will be reviewed by the advisory board to determine if these courses are meeting the needs of the science education students. Second, the professionalism of science and technology education students has been discussed by faculty in the discipline area work group (DAWG). The science and technology education faculty have decided to address professionalism in the introductory course (STMED 160) during the freshmen year. Students will be required to attend and participate in professional organizations and events, in addition to the regular coursework. Science Education AIM Report 2008 Page 9

