2009 B.S. in Special Education Assessment in the Major Report
advertisement
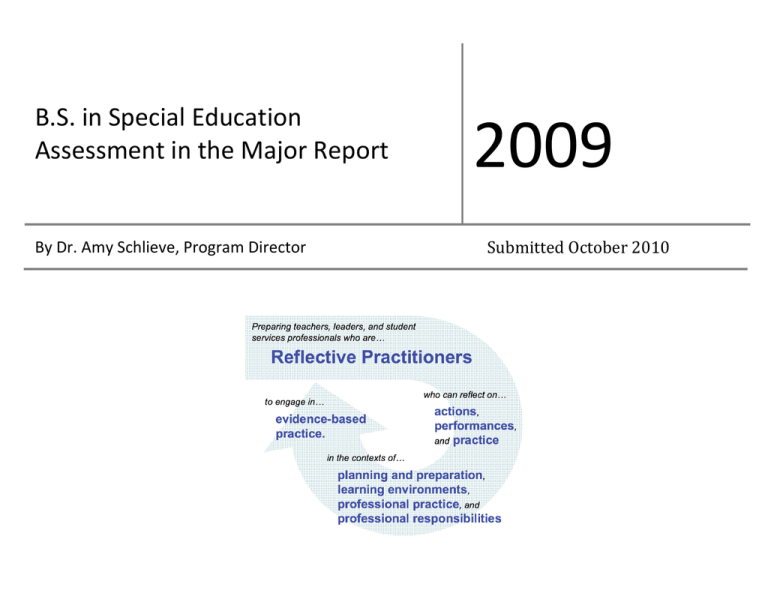
B.S. in Special Education Assessment in the Major Report By Dr. Amy Schlieve, Program Director 2009 Submitted October 2010 Table of Contents Overview ..................................................................................................................................................................................................................1 PRAXIS I: Pre-Professional Skills Test .................................................................................................................................................................1 PRAXIS II: Middle School Content Test Summary ...............................................................................................................................................2 Summary at Benchmark I, II and III ........................................................................................................................................................................4 Disposition Ratings ..................................................................................................................................................................................................8 Student Teacher Ratings…………………………………………………………………………………………………………………………10 Educational Benchmarking Inventory (EBI) .........................................................................................................................................................12 Communicating Assessment Data with Constituencies .........................................................................................................................................15 Utilization of Assessment Data to Improve Courses and the Program ..................................................................................................................19 Advisory Board Members Spring 2008 .................................................................................................................................................................19 Recruitment Plan ....................................................................................................................................................................................................20 Advisement Plan ....................................................................................................................................................................................................20 Retention Plan ........................................................................................................................................................................................................20 Overview The University of Wisconsin-Stout School of Education (SOE) has gathered assessment data gathered from fall semester 2003 through December 2009. In the School of Education, data is gathered from several sources to inform unit and program decisions. Data in this report is used to develop program goals, inform curriculum changes, and enhance course delivery in order to improve teacher education candidate learning. This report contains data from the PRAXIS I: Pre-Professional Skills Test, PRAXIS II: Middle School Content Test, Benchmark Interviews, Student Teacher Performances, and the Educational Benchmarking Inventory (EBI). This report also describes how assessment data is used to set programmatic goals, improve the program, program curriculum, and delivery of courses. PRAXIS I: Pre-Professional Skills Test PPST Attempts and Pass Rates Due to the Datatel to PeopleSoft conversion, we are not currently able to disaggregate PPST pass percentages by program. This process is being developed. We hope to have this capability by 2011. Therefore, we only have disaggregated data through 2008. SPED Math Reading Writing 2004 # test attempts ------------- VR (SPED certificate) Math Reading Writing 32 33 32 26 = 81% 24 = 73% 21 = 66% 8 10 9 5 = 63% 6 = 60% 3 = 33% 6 4 7 Math 266 215 = 80.8% 189 151 = 80.0% 204 Reading 368 214 = 58.2% 239 138 = 57.7% 280 Writing 425 206 = 48.5% 277 136 = 49.1% 296 Teacher Education Program Undergraduate TOTALS PPST Test Special Education AIM Report 2009 2004 # (and %) passed ------------- 2005 # test attempts 8 9 11 2005 # (and %) passed 7 = 88% 4 = 44% 6 = 55% 2006 # test attempts 15 28 24 2006 # (and %) passed 12 = 80% 11 = 39% 13 = 54% 2007 # test attempts 20 23 23 2007 # (and %) passed 13 10 14 2008 # test attempts 16 22 18 2008 # (and %) passed 14 = 88% 18 = 82% 12 = 67% 5 = 83% 2 = 50% 4 = 57% 148 = 72.5% 145 = 51.8% 161 = 54.4% 1 3 2 1 2 2 1 1 -- 0 (0%) 0 (0%) 226 191 = 84.5% 130 102 = 78.5% 243 184 = 75.7% 150 119 = 79.3% 257 200 = 77.8% 138 104 = 75.4% -- Page 1 PRAXIS II: Middle School Content Test Summary For the students in the Special Education (SE), as well as those students with Vocational Rehabilitation with Special Education Certification in Cognitive Disabilities must take and pass the PRAXIS II Middle School Content test prior to being allowed to student teach. Four areas are covered in the PRAXIS II Middle School Content Test: literature, mathematics, history/social studies, and science. The score needed to pass the Content Test is 146. The most recent data shows the lowest score for SE and VR/SE was 128 and the highest was 181 with a passing rate of 71%. No comparisons were conducted among the UW-Stout teaching majors as this is the only major required to take this exam. Most of the other majors are actually being tested on the content of their major. As with PRAXIS I, the data does not delineate between individuals between individuals who are taking the test for the first time from those who are repeating the test – thus, it is impossible to determine the first time passing rate. However, comparisons with other state test-takers suggest that UW-Stout SPED majors have more difficulty answering literacy and mathematics test questions on the PRAXIS II than others in Wisconsin. Note that all candidates are required to pass the Praxis II to be admitted to student teaching as part of Benchmark II so the pass rate is 100% upon Benchmark II approval. Content Test from ETS Number of Examinees: Highest Observed Score: Lowest Observed Score: Median: Average Performance Range: Score Needed to Pass: Number with Passing Score: Percent with WI Passing Score: Special Education AIM Report 2009 03/04 04/05 05/06 06/07 07/08 08/09 59 184 101 149 136-163 146 34/59 58% - 15 185 128 148 143-159 146 9 60% 27 177 134 151 148-162 146 21/27 78% 34 174 122 152 147-158 146 28/34 82% 28 181 128 152 143-162 146 20/28 71% Page 2 Average Percent Correct on PRAXIS II (number of items answered correctly by area) Middle School Content Test Category Literature Mathematics History / Social Studies Science UW-Stout Points 03/04 04/05 05/06 06/07 07/08 08/09 Available % % % % % % 26-30 59 65 66 64 64 28-30 53 58 62 60 61 Wisconsin 08/09 % 72 70 28-30 53 - 56 53 53 52 58 28-30 59 - 58 60 58 61 64 2008/2009 Percent of Items Answered Correctly on the PRAXIS II 80 70 60 50 40 UW-Stout 30 Wisconsin 20 10 0 Family Special Education AIM Report 2009 Human Management Nutrition/Food Development Page 3 Summary at Benchmark I, II and III All students must satisfactorily complete BMI to advance to BMII. All students must successfully complete BMII to student teach. Please see below for a summary of the results. Benchmark I Interview Results Special Education Question Explain personal and professional growth between your initial resume and updated resume. Explain your philosophy of education. Explain three personal characteristics that will make you an effective teacher. Describe yourself as a learner and how that will impact your future teaching. Describe experiences that have impacted your understanding of diversity and human relations and how these might aid you as you work with students and families Explain two subject matter/content artifacts and Special Education AIM Report 2009 0 7 0 7 0 7 0 7 FA08 N=7 0% 100% 0% 100% 0% 100% 0% 100% 0 0% 0 0% Satisfactory 5 100% 7 Unsatisfactory 0 0% 0 Response Unsatisfactory Satisfactory Unsatisfactory Satisfactory Unsatisfactory Satisfactory Unsatisfactory Satisfactory 0 5 0 5 0 5 0 5 Unsatisfactory SP08 N=5 0% 100% 0% 100% 0% 100% 0% 100% 0 1 0 1 0 1 0 1 FA09 N=1 0% 100% 0% 100% 0% 100% 0% 100% 0 0% 0 0% 100% 10 100% 1 0% SP09 N=10 0 0% 10 100% 0 0% 10 100% 0 0% 10 100% 0 0% 10 100% 0 0% 0 SOE UNIT SP09 FA09 N=69 N=27 1 1% 2 7% 68 99% 25 93% 1 1% 0 0% 68 99% 27 100% 0 0% 1 4% 69 100% 26 96% 0 0% 1 4% 69 100% 26 96% 1 100% 68 0% 2 1% 1 4% 99% 26 96% 3% 3 11% Page 4 how these examples illustrate your understanding of the content you will be teaching Completed Alignment Summary Special Education AIM Report 2009 Satisfactory Unsatisfactory Satisfactory 5 0 5 100% 7 0% 0 100% 7 100% 10 0% 0 100% 10 100% 1 0% 0 100% 1 100% 67 0% 2 100% 67 97% 24 89% 3% 0 0% 97% 27 100% Page 5 Benchmark II Interview Results Special Education SP08 N=8 Question Describe your Philosophy of Education and how it has evolved Describe what it means to be a "Reflective Practitioner" Describe the WI Teacher Standard and Domain you feel most competent in Describe the WI Teacher Standard and Domain you have experienced the greatest growth Response Unsatisfactory Emerging Basic n/a Unsatisfactory Emerging Basic n/a Unsatisfactory Emerging Basic n/a Unsatisfactory Emerging Basic n/a Fre. 0 1 6 1 0 2 5 1 0 4 3 1 0 4 3 1 % 0% 13% 75% 13% 0% 25% 63% 13% 0% 50% 38% 13% 0% 50% 38% 13% FA08 N=12 Fre. 0 6 6 0 0 7 5 0 0 6 6 0 0 6 6 0 % 0% 50% 50% 0% 0% 58% 42% 0% 0% 50% 50% 0% 0% 50% 50% 0% SP09 N=8 Fre. % FA09 N=9 Fre. 0 0% 0 0% 8 100% 0 0% 0 0% 1 13% 7 88% 0 0% 0 0% 1 13% 7 88% 0 0% 0 0% 0 0% 8 100% 0 0% % SOE UNIT SP09 FA09 N=70 N=59 Fre. % Fre. % 0 0% 0 0% 9 100% 0 0% 0 0% 0 0% 9 100% 0 0% 0 0% 1 11% 8 89% 0 0% 0 0% 0 0% 9 100% 0 0% 1 16 53 0 2 17 51 0 1 13 56 0 1 12 57 0 1% 23% 76% 0% 3% 24% 73% 0% 1% 19% 80% 0% 1% 17% 81% 0% 2 21 36 0 1 16 42 0 1 12 46 0 1 21 37 0 3% 36% 61% 0% 2% 27% 71% 0% 2% 20% 78% 0% 2% 36% 63% 0% 0 0 8 1 0 0 0 9 0 1 8 26 35 0 1 9 60 2 1% 11% 37% 50% 0% 1% 13% 86% 3% 1 10 20 28 0 3 4 52 8 2% 17% 34% 47% 0% 5% 7% 88% 14% Reviewers choose 2 of the following; discuss portfolio evidence that: demonstrates your content knowledge demonstrates your knowledge of how children grow and learn demonstrates your ability to create Special Education AIM Report 2009 Unsatisfactory Emerging Basic n/a Unsatisfactory Emerging Basic n/a Unsatisfactory 0 2 5 1 0 4 1 3 0 0% 25% 63% 13% 0% 50% 13% 38% 0% 0 5 6 1 0 2 4 6 0 0% 42% 50% 8% 0% 17% 33% 50% 0% 0 0 5 3 0 0 3 5 0 0% 0% 63% 38% 0% 0% 38% 63% 0% Page 6 instructional opportunities adapted to diverse learners demonstrates your ability to teach effectively demonstrates your ability to manage a classroom effectively, including organizing physical space, managing procedures and student behavior, and creating a culture of respect, rapport, and learning demonstrates your ability to communicate effectively with students, parents, and colleagues demonstrates your ability to assess student learning demonstrates your professionalism, including ongoing professional development; fostering relationships with colleagues, families, and the community; and displaying ethical behavior expected of education professionals Special Education AIM Report 2009 Emerging Basic n/a Unsatisfactory Emerging Basic n/a Unsatisfactory Emerging Basic 4 1 3 0 4 1 3 0 4 1 50% 13% 38% 0% 50% 13% 38% 0% 50% 13% 3 5 4 0 2 5 5 0 4 4 25% 42% 33% 0% 17% 42% 42% 0% 33% 33% 0 4 4 0 0 3 5 0 0 4 0% 50% 50% 0% 0% 38% 63% 0% 0% 50% 0 1 8 0 0 0 9 0 0 8 7 33 28 0 1 10 59 1 6 22 10% 47% 40% 0% 1% 14% 84% 1% 9% 31% 3 11 37 0 3 6 50 0 13 15 5% 19% 63% 0% 5% 10% 85% 0% 22% 25% n/a Unsatisfactory Emerging Basic n/a Unsatisfactory Emerging Basic n/a Unsatisfactory Emerging Basic 3 0 2 5 1 0 3 4 1 0 2 5 38% 0% 25% 63% 13% 0% 38% 50% 13% 0% 25% 63% 4 0 1 4 7 0 3 4 5 0 2 3 33% 0% 8% 33% 58% 0% 25% 33% 42% 0% 17% 25% 4 0 1 4 3 0 1 7 0 0 0 2 50% 0% 13% 50% 38% 0% 13% 88% 0% 0% 0% 25% 1 0 1 2 6 0 1 5 3 0 0 0 41 0 2 20 48 1 8 28 33 0 8 8 59% 0% 3% 29% 69% 1% 11% 40% 47% 0% 11% 11% 31 0 5 4 50 0 14 19 26 0 4 13 53% 0% 8% 7% 85% 0% 24% 32% 44% 0% 7% 22% n/a 1 13% 7 58% 6 75% 9 54 77% 42 71% Page 7 Benchmark III Interview Results Special Education Question Response Unsatisfactory Emerging Artifacts from student teaching, reflection ratings Basic Proficient n/a Unsatisfactory Emerging Final Student Teaching Assessments and Basic Recommendations from Cooperating Teachers Proficient n/a Unsatisfactory Emerging Disposition ratings from student teaching from Basic cooperating & University Supervisors Proficient n/a Unsatisfactory Emerging Alignment Summary of artifacts meeting all 10 Wisconsin Teaching Standards & 4 Domains/ Basic Components & reflections/ reflection ratings Proficient n/a Special Education AIM Report 2009 0 0 1 8 0 0 0 0 9 0 0 0 1 8 0 0 0 1 8 0 SP08 N=9 0% 0% 11% 89% 0% 0% 0% 0% 100% 0% 0% 0% 11% 89% 0% 0% 0% 11% 89% 0% FA08 N=6 0 0% 0 0% 3 50% 3 50% 0 0% 0 0% 1 17% 2 33% 3 50% 0 0% 0 0% 1 17% 2 33% 3 50% 0 0% 0 0% 2 33% 2 33% 3 50% 0 0% SP09 N=15 0 0% 0 0% 1 7% 14 93% 0 0% 0 0% 0 0% 0 0% 15 100% 0 0% 0 0% 0 0% 1 7% 13 87% 1 7% 0 0% 0 0% 0 0% 15 100% 0 0% 0 0 0 4 0 0 0 0 4 0 0 0 0 3 1 0 1 1 2 0 FA09 N=4 0% 0% 0% 100% 0% 0% 0% 0% 100% 0% 0% 0% 0% 75% 25% 0% 25% 25% 50% 0% SOE UNIT SP09 FA09 N=80 N=47 0 0% 0 0% 2 3% 1 2% 23 29% 7 15% 55 69% 39 83% 0 0% 0 0% 0 0% 0 0% 3 4% 0 0% 24 30% 7 15% 51 64% 47 100% 2 3% 0 0% 0 0% 0 0% 1 1% 0 0% 23 29% 3 6% 38 48% 17 36% 18 23% 29 62% 0 0% 0 0% 7 9% 5 11% 16 20% 5 11% 56 70% 37 79% 1 1% 0 0% Page 8 Disposition Ratings The School of Education is in the process of revising and improving upon our dispositional rating process. In the interim, we are gathering dispositional data (satisfactory/unsatisfactory) each spring on undergraduate students prior to their student teaching experience. If a student receives an unsatisfactory rating, he/she must remediate his/her disposition before allowed to progress in their program (through Benchmark I or II). 100% satisfactory disposition ratings are required at the time of Benchmark I and Benchmark II. Starting in spring of 2010 a disposition form was implemented during student teaching with categories that align directly to our statement of values and disposition. These factors include: “Initiative, Preparedness & Continuous Learning”, “Academic Excellence through Critical Reflective Thinking”, “Expression of Beliefs, Collaboration and Professional Communication”, “Adherence to Ethical and Legal Considerations”, and “Respect for Diversity”. Students are rated on a 3-point scale: Unsatisfactory/Emerging, Basic, and Proficient, by their cooperating teachers. A student would not be eligible for licensure if an unsatisfactory/emerging rating was reported during student teaching. Special Education AIM Report 2009 Page 9 Student Teaching Performance Ratings The table below indicates the final ratings for student teacher competencies in the ten Wisconsin Teacher Standards. After completion of their student teaching experience, each student should be at the emerging or basic level. Based on the data, all student teachers are satisfactorily prepared for licensure. It is also evident that the Special Education Candidates consistently rate at or above the Unit means. See table below. Student Teacher Course Evaluations Special Education Rating Scale: 1=Unsatisfactory, 2=Emerging, 3=Basic, 4=Proficient SOE UNIT SP08 N=9 Std Mean Dev Teachers know the subjects they are teaching Teachers know how children grow Teachers understand that children learn differently Teachers know how to teach Teachers know how to manage a classroom Teachers communicate well Teachers are able to plan different kinds of lessons Teachers know how to test for student progress Teachers are able to evaluate themselves Teachers are connected with other teachers and the community Special Education AIM Report 2009 FA08 N=4 Std Mean Dev SP09 N=15 Std Mean Dev FA09 N=5 Std Mean Dev SP09 N=78 Std Mean Dev FA09 N=74 Std Mean Dev 3.89 3.89 0.33 0.33 4.00 4.00 0.00 0.00 3.87 3.80 0.52 0.56 3.80 3.60 0.45 0.89 3.87 3.75 0.36 0.39 3.72 3.71 0.32 0.39 4.00 3.89 0.00 0.33 4.00 4.00 0.00 0.00 3.87 3.80 0.52 0.56 3.60 3.60 0.89 0.89 3.82 3.77 0.35 0.39 3.70 3.79 0.42 0.47 3.78 3.89 0.44 0.33 3.75 3.50 0.50 0.58 3.80 3.80 0.56 0.41 3.60 3.80 0.89 0.45 3.73 3.74 0.47 0.40 3.68 3.67 0.46 0.36 3.78 0.44 3.75 0.50 3.73 0.59 3.60 0.89 3.84 0.41 3.75 0.37 3.89 0.33 4.00 0.00 3.67 0.72 3.00 1.73 3.81 0.45 3.48 0.67 3.78 0.44 3.75 0.50 3.80 0.56 3.80 0.45 3.84 0.36 3.75 0.32 3.78 0.44 3.45 0.53 3.67 0.90 3.80 0.45 3.62 0.52 3.66 0.37 Page 10 Student Teacher Course Evaluations Special Education Rating Scale: 1=Unsatisfactory, 2=Emerging, 3=Basic, 4=Proficient 4.00 3.90 3.80 3.70 3.60 3.50 3.40 3.30 3.20 3.10 3.00 SP08: N=9 FA08: N=4 SP09: N=15 FA09: N=5 Special Education AIM Report 2009 Page 11 Educational Benchmarking Inventory (EBI) Fourteen factors are assessed through the EBI (Scale= 1-7 with 1= not at all, 4= moderately and 7= extremely) at the conclusion of candidates’ student teaching experiences. The tables below report the data on the 14 factors. Beginning with the fall semester 2007 an online and summer rotation began for all required special education courses. This rotation supports non-traditional undergraduate students who are often limited in the number of courses they are able to take during the day. Special Education AIM Report 2009 Page 12 Special Education AIM Report 2009 Page 13 EBI - Institution Specific Questions 2009-2010 Mean Data; Scale 1-7 ARTED CTET ECE FCSE MBE SPED TECED SOE N=8 N=11 N=43 N=10 N=10 N=9 N=20 N=127 To what degree were you prepared to create meaningful learning experiences for students based on your content knowledge? 5.75 5.80 5.59 5.20 5.60 6.12 4.67 5.42 To what degree were you prepared to provide instruction that fosters student learning and intellectual, social and personal development? 4.75 5.60 5.54 5.10 5.30 6.25 4.65 5.29 To what degree were you prepared to create instructional experiences adapted for students who learn differently? 4.75 5.70 5.56 4.90 5.00 6.12 4.45 5.21 To what degree were you prepared to use a variety of learning strategies including the use of technology to encourage critical thinking and problem solving? 5.00 5.60 5.34 5.70 5.80 5.75 4.80 5.32 To what degree were you prepared to manage classroom behavior and create a learning environment that encourages positive social interaction, active engagement in learning and self-motivation? 4.62 5.10 5.41 4.40 4.80 5.57 4.20 4.91 To what degree were you prepared to use instructional technology and media to foster active inquiry, collaboration and interaction in the classroom? 4.38 5.60 4.82 5.60 6.30 5.38 4.65 5.05 To what degree were you prepared to plan instruction based on knowledge of subject matter, students, the community and curriculum goals? 5.25 5.10 5.60 5.10 6.20 5.75 4.75 5.35 To what degree were you prepared to use formal and informal assessment strategies to evaluate student progress? 4.43 4.90 5.05 5.20 6.00 6.00 4.80 5.14 To what degree were you prepared to reflect on teaching and evaluate the effects of choices and actions on pupils, parents and others? 5.12 5.30 6.06 5.10 5.70 6.29 5.00 5.60 To what degree were you prepared to foster relationships with colleges, families and the community to support student learning and well-being? 5.00 4.90 5.70 5.10 4.90 6.25 4.30 5.16 *We updated our questions for the 2009-2010 school year therefore trend data is not available Special Education AIM Report 2009 Page 14 Communicating Assessment Data with Constituencies Data will be communicated to faculty members through informal and formal means. Program faculty meet during scheduled discipline area work group meetings (DAWG) designed to support ongoing program improvement. Program faculty and staff then discuss ways to better meet the needs of students throughout the program. Action plans for desired change result from work group meetings. Each SPED faculty member is charged to lead an area of improvement. Program advisory board members also receive a copy of and discuss the assessment in the major report. At the fall meeting of each year the document is summarized and discussed as to their recommendations for improvement. Supervising teachers are in charge of informing their cooperating teachers of the document and requesting feedback from them regarding improvements they recommend for the program. Utilization of Assessment Data to Improve Courses and the Program With feedback from program faculty and staff, advisory board members, and cooperating teachers, there are continuous improvements being made to the program. The program plan sheet for Special Education – Cross-Categorical was again modified to reflect when the courses are offered. Since the faculty and staff allocations are small (although the program is experiencing steady growth) some courses are offered once a year. A course rotation was developed several years ago to offer one special education course per semester in evening or online format. Additionally, beginning in fall ’09 two C & I Methods and prestudent teaching experiences are offered online. Students rotate between coursework online and direct teaching in a field experience. Informal data collected indicated an increase in satisfaction in both the content and more authentic field experiences. Assessment data collected also indicated a need for additional tenured/tenure track faculty. A search was conducted second semester of 2009-10 and a new tenuretrack faculty was hired began teaching in fall 1020. The following are changes or improvements planned for the upcoming year. • DAWG group and Advisory Board will discuss possible provisions for Fall 2011 • PD will monitor PPST and PRAXIS II test scores to determine the need for future program revisions • PD will continue to work closely with Minnesota Department of Education to ensure that Stout SPED graduates are certifiable in Minnesota • PD will continue to work with SOE in designating a classroom space in VR that is equipped with up-to-date media and technology equipment • Continue to recruit quality candidates with an emphasis on encouraging minorities and high school males to SPED • Continue to foster and improve relationships with partnering schools primarily through authentic prestudent teaching experiences and assistance with DIBELS testing Advisory Board Members Spring 2008 Dr. Kevin McDonald - College of Technology, Engineering, and Management Stephanie Hotujec- alumni and graduate student in the program. Special Education teacher at Durand High school Natasha Daniels - student ambassador for special education Vicky Thomas - advisement Sandy White - Continuing Education Dr. Laura Schmidt - Mathematics Special Education AIM Report 2009 Page 15 Sue Curtis, Director of Special Education – New Richmond School District Dana Maney - Director of Special Education, CESA 11 Melissa Gumness - Undergraduate/Certification/Graduate Alumni. Special Education teacher with Eau Claire Area School District Dr. Mary Hopkins-Best -Dean of CEHH (ex-officio member) As per recommendations in 2008 and again in 2009, Advisory Board meets face-to-face one time per year and via electronic communication for other meetings and issues as necessary. Recruitment Plan An update of the glossy fliers will be sent to every school district in the area, as well as to alumni. Many alumni have shown interest in coming back for courses to enhance their degree in Special Education. In fall of 2005 we started a cohort program to directly respond to the alumni by offering evening and weekend courses to accommodate their full-time working schedules. Working with Dr. Schlieves’ and Celene Fry’s offices to coordinate efforts will continue. Brochures have been sent to all of the conferences where faculty members have attended (i.e. WI Indian Education Association, WI School Counselor Association, and Council for Exception Children national conference). The program also utilizes the SOE SPED Ambassador for school visits and follow-up correspondence after Preview Days and campus visits. Head count numbers for Fall 2010 Intro to Special Education are at 52 (with 16 transfers) up from 34 (14 tranfers) in 2009. Advisement Plan Each semester during the scheduled Advisement Day, students sign up for an hour block of time to meet with faculty advisors in a group format. Questions are raised and answered, program plans sheets are updated, students are informed of changes in scheduling, offerings, prerequisites, and program. Students can work individually with a faculty advisor during this time or with peers to determine their schedules. If substitutions and a full evaluation of their program plans are needed, appointments are made with the program director. Students are expected to attend each Advisement Day. Beginning in spring ’07 students now register for advisement via the internet in class ranking blocks. This method has increased the number of Advisement Day participants and class rank schedule has allowed Drs Amy Schlieve and Ruth Nyland to directly and effectively deal with class rank specific issues more efficiently and effectively. Dr. Ruth Nyland, Dr. Amy Schlieve, Dr. Amy Gillett, and Renee Chandler, ABD were the program faculty with Bonnie Shaw (retired principal and special education teacher) and Vicki Dowell (retired special education teacher) serving as adjunct faculty. Retention Plan Through advisement and class interactions, retention should remain high for the major. Due to the requirements of the e-portfolio, the content exam, and benchmark interviews, there has been some movement away from all teaching majors on campus. Also, the Wisconsin required Middle School Content test being a broad middle level exam, rather than specific to the major, passing of this exam will continue to be problematic for many of our students as it is for other Special Education majors in the state. Special Education AIM Report 2009 Page 16 Students’ program plan sheets are updated each semester to verify their progress toward graduation. When there has been an academic problem, the student has been advised of his/her options for remediation of the problem and how the program faculty has helped. In some instances, students have been counseled out of the program and referred to other majors and program directors on campus. Special Education AIM Report 2009 Page 17

