SCORING PROFILE END-OF-UNIT ASSESSMENT
advertisement
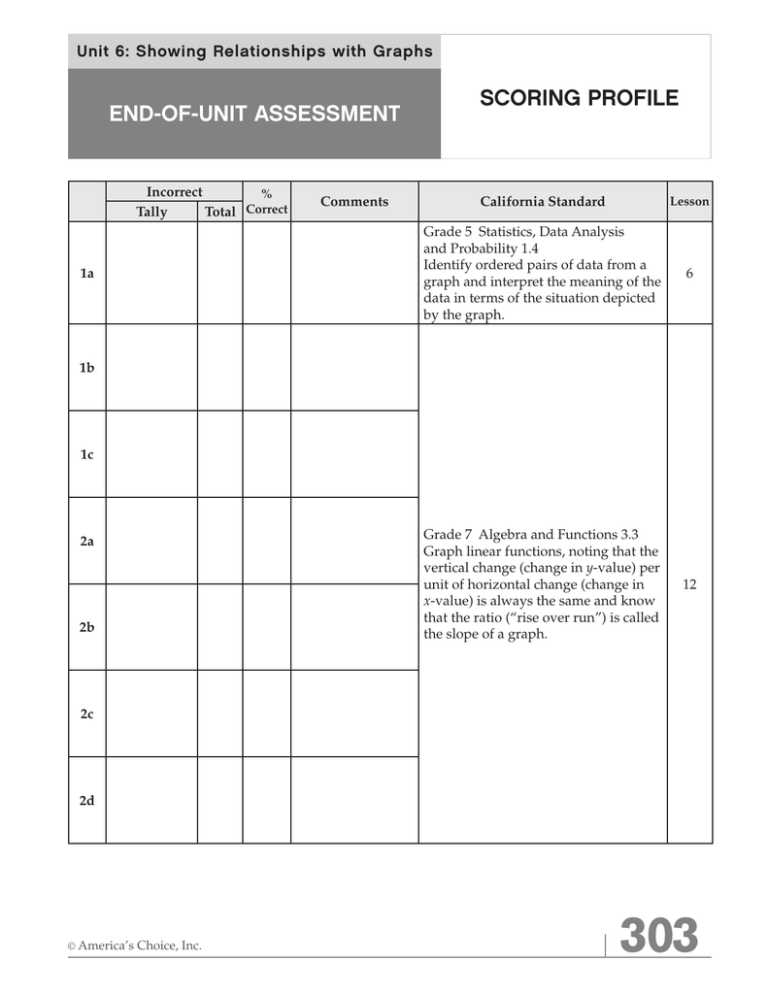
Unit 6: Showing Relationships with Graphs END-OF-UNIT ASSESSMENT Incorrect % Correct Tally Total 1a Comments SCORING PROFILE California Standard Lesson Grade 5 Statistics, Data Analysis and Probability 1.4 Identify ordered pairs of data from a graph and interpret the meaning of the data in terms of the situation depicted by the graph. 6 Grade 7 Algebra and Functions 3.3 Graph linear functions, noting that the vertical change (change in y-value) per unit of horizontal change (change in x-value) is always the same and know that the ratio (“rise over run”) is called the slope of a graph. 12 1b 1c 2a 2b 2c 2d © America’s Choice, Inc. | 303 End-of-Unit Assessment Incorrect % Tally Total Correct UNIT 6 Comments California Standard Lesson Grade 7 Algebra and Functions 3.3 Graph linear functions, noting that the vertical change (change in y-value) per unit of horizontal change (change in x-value) is always the same and know that the ratio (“rise over run”) is called the slope of a graph. 13 3a 3b 3c 3d Grade 4 Measurement and Geometry 3.1 Identify lines that are parallel and perpendicular. 4a 4b 4c Grade 7 Algebra and Functions 3.3 Graph linear functions, noting that the vertical change (change in y-value) per unit of horizontal change (change in x-value) is always the same and know that the ratio (“rise over run”) is called the slope of a graph. 13 Grade 5 Algebra and Functions 1.5 Solve problems involving linear functions with integer values; write the equation; and graph the resulting ordered pairs of integers on a grid. 14 4d 5a 304 | © America’s Choice, Inc. SCORING PROFILE Incorrect % Tally Total Correct 5b 6a 6b Showing Relationships with Graphs Comments California Standard Lesson Grade 4 Measurement and Geometry 3.1 Identify lines that are parallel and perpendicular. 14 Grade 5 Statistics, Data Analysis and Probability 1.4 Identify ordered pairs of data from a graph and interpret the meaning of the data in terms of the situation depicted by the graph. 15 TOTALS © America’s Choice, Inc. | 305
