S - MEMS C
advertisement

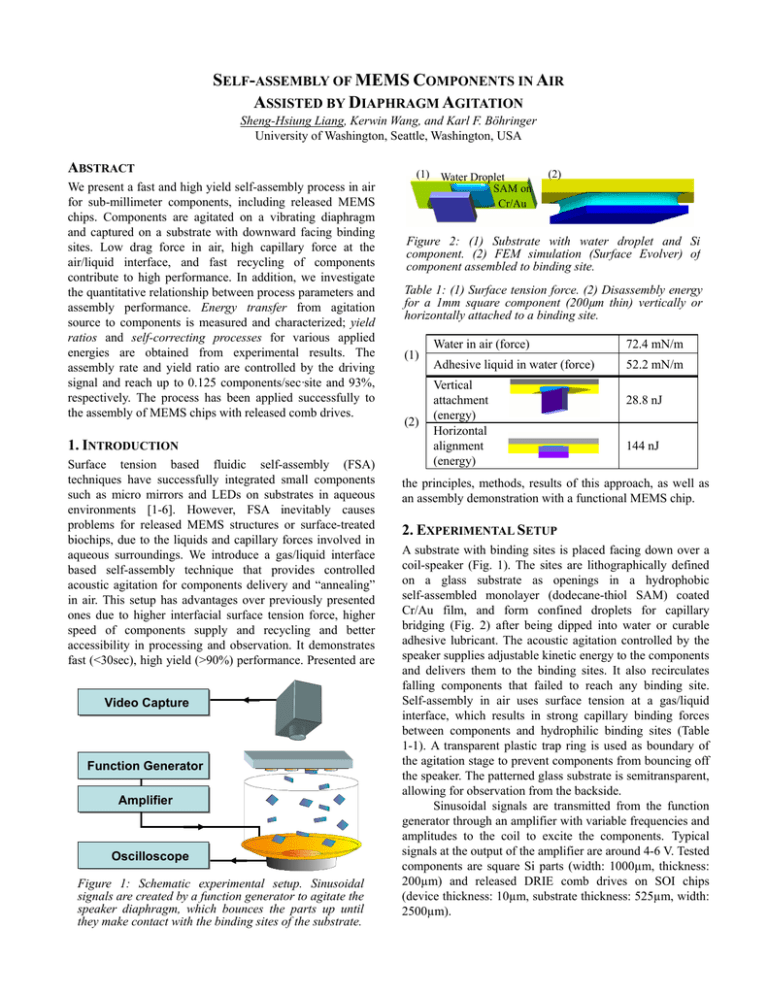
SELF-ASSEMBLY OF MEMS COMPONENTS IN AIR ASSISTED BY DIAPHRAGM AGITATION Sheng-Hsiung Liang, Kerwin Wang, and Karl F. Böhringer University of Washington, Seattle, Washington, USA ABSTRACT We present a fast and high yield self-assembly process in air for sub-millimeter components, including released MEMS chips. Components are agitated on a vibrating diaphragm and captured on a substrate with downward facing binding sites. Low drag force in air, high capillary force at the air/liquid interface, and fast recycling of components contribute to high performance. In addition, we investigate the quantitative relationship between process parameters and assembly performance. Energy transfer from agitation source to components is measured and characterized; yield ratios and self-correcting processes for various applied energies are obtained from experimental results. The assembly rate and yield ratio are controlled by the driving signal and reach up to 0.125 components/sec·site and 93%, respectively. The process has been applied successfully to the assembly of MEMS chips with released comb drives. 1. INTRODUCTION Surface tension based fluidic self-assembly (FSA) techniques have successfully integrated small components such as micro mirrors and LEDs on substrates in aqueous environments [1-6]. However, FSA inevitably causes problems for released MEMS structures or surface-treated biochips, due to the liquids and capillary forces involved in aqueous surroundings. We introduce a gas/liquid interface based self-assembly technique that provides controlled acoustic agitation for components delivery and “annealing” in air. This setup has advantages over previously presented ones due to higher interfacial surface tension force, higher speed of components supply and recycling and better accessibility in processing and observation. It demonstrates fast (<30sec), high yield (>90%) performance. Presented are Video Capture Function Generator Amplifier Oscilloscope Figure 1: Schematic experimental setup. Sinusoidal signals are created by a function generator to agitate the speaker diaphragm, which bounces the parts up until they make contact with the binding sites of the substrate. (1) Water Droplet SAM on Cr/Au (2) Figure 2: (1) Substrate with water droplet and Si component. (2) FEM simulation (Surface Evolver) of component assembled to binding site. Table 1: (1) Surface tension force. (2) Disassembly energy for a 1mm square component (200µm thin) vertically or horizontally attached to a binding site. (1) (2) Water in air (force) 72.4 mN/m Adhesive liquid in water (force) 52.2 mN/m Vertical attachment (energy) Horizontal alignment (energy) 28.8 nJ 144 nJ the principles, methods, results of this approach, as well as an assembly demonstration with a functional MEMS chip. 2. EXPERIMENTAL SETUP A substrate with binding sites is placed facing down over a coil-speaker (Fig. 1). The sites are lithographically defined on a glass substrate as openings in a hydrophobic self-assembled monolayer (dodecane-thiol SAM) coated Cr/Au film, and form confined droplets for capillary bridging (Fig. 2) after being dipped into water or curable adhesive lubricant. The acoustic agitation controlled by the speaker supplies adjustable kinetic energy to the components and delivers them to the binding sites. It also recirculates falling components that failed to reach any binding site. Self-assembly in air uses surface tension at a gas/liquid interface, which results in strong capillary binding forces between components and hydrophilic binding sites (Table 1-1). A transparent plastic trap ring is used as boundary of the agitation stage to prevent components from bouncing off the speaker. The patterned glass substrate is semitransparent, allowing for observation from the backside. Sinusoidal signals are transmitted from the function generator through an amplifier with variable frequencies and amplitudes to the coil to excite the components. Typical signals at the output of the amplifier are around 4-6 V. Tested components are square Si parts (width: 1000µm, thickness: 200µm) and released DRIE comb drives on SOI chips (device thickness: 10µm, substrate thickness: 525µm, width: 2500µm). 3. ENERGY TRANSFER & COMPONENT DELIVERY The purpose of this section is to quantify the dynamics of the self-assembly process. Energy measurement and analysis is performed to ensure that the transferred energy is within a range that is large enough for components delivery and self-correction of misaligned components, but small enough to avoid disturbing well-aligned components. Self-correction is the process of knocking out incorrectly assembled components while not interfering with correctly completed assemblies. Table 1-2 shows a scenario that is favorable for self-correction: a component in vertical misalignment requires less energy to detach (28.8nJ) than a correctly captured component in horizontal alignment (144nJ). In the remainder of this section, we calculate the maximum kinetic energy of components after multiple impacts from their highest bouncing altitude (maximum potential energy) and determine their restitution coefficient. Then we compare the maximum impact energy of components at binding sites with the energy barriers for self-assembly and self-correction. Dynamic Characteristics of the Speaker The speaker setup has been investigated by sinusoidal signals with variable frequencies and amplitudes (Fig. 3). The measured amplitudes A of the speaker diaphragm under Ekin (nJ) f (Hz) V (V) Epot (nJ) f (Hz) V (V) Figure 3: Dynamic characteristics of the experimental setup. At 240Hz, the maximum (1) kinetic energy and (2) potential energy are observed by measurement. different driving voltages V and frequencies f are converted to maximum velocities of the diaphragm vd,max and corresponding kinetic energies Ekin: xd = A sin (2π f t) (1) x′d = 2π f A cos(2π f t) (2) vd,max = max[ x′d ] = 2π f A (3) Ekin = ½ mc (vd,max)2 (4) xd represents the movement of the diaphragm as a function of time, which depends on diaphragm amplitude A and signal frequency f. mc is the mass of the component. The measured maximum heights hmax the components can reach are converted to maximum potential energies Epot,max. These results can be used to estimate the maximal initial velocity of the components vc,max: Epot,max = mc g hmax (5) vc,max = √(2Epot / mc) = √(2 g hmax) (6) Maximum Bouncing Height in Steady State Our calculation shows that a steady state in maximum bounce altitude is reached after 6~7 collisions between components and speaker diaphragm. Under steady state, when a component drops from the maximum height hmax and collides with the diaphragm under its maximum relative velocity, it will bounce back to the same altitude hmax. Restitution Coefficient of Collisions The restitution coefficient α describes the fraction of kinetic energy retained after a collision. The velocities before and after the collision between a component and the diaphragm obey the following relationship: α = – (v*c – v*d) / (vc – vd) (7) where vc and v*c are the velocity of the component before and after impact, and vd and v*d are the velocity of the diaphragm before and after impact, respectively. Here, the masses of the components are insignificant compared to the mass of the speaker diaphragm; therefore, the speed of the diaphragm is not affected by the collision with the components, and we can assume v*d = vd. Note that we assume impacts normal to the diaphragm surface. We calculate the restitution coefficient under steady state as described in the previous section, and insert vd = v*d = vd,max from Eq. (3) and –vc = v*c = vc,max from Eq. (6) into Eq. (4) to obtain α = (vc,max – vd,max) / (vc,max + vd,max) (8) From measured A and hmax, we calculate α and obtain an average value of 0.22 with 14% variance. Multiple impacts between a component and the vibrating diaphragm can produce velocities higher than vd,max if α > 0. It can be shown that the maximum attainable velocity is vc,max = vd,max (1 + α) / (1 – α) (9) With α=0.22, vc,max is 1.56 times vd,max, which is consistent with our experimentally determined values of vd,max and vc,max from Eqs. (3) and (6). Maximum kinetic energy Ekin,max is therefore increased by 2.44 compared to Eq. (4) (Fig. 4-1). Impacts between Bouncing and Assembled Components In order to let most of the components reach the binding sites, the substrate altitude h0 is set lower than the maximum bouncing height hmax of unconstrained components. Thus, components may have some remaining kinetic energy at impact with binding sites; the maximum kinetic energy at impact can be calculated from h0 and vc,max: Ekin,impact = ½ mc (vc,max)2 – mc g h0 (10) Ideally the maximal impact energy should be large enough to correct the misaligned components but small enough to keep the correctly assembled components in their place. According to a first order model on surface energy [7], the estimated energy required to knock out a vertically attached component from a binding sites is 28.8nJ (Table 1-2). In contrast, properly aligned horizontal components can be expelled only with at least 144nJ of impact energy. Ekin,impact is calculated and compared with this disassembly energy of aligned components. However, this calculation produces very high impact energies for our experimental values of vc,max (Figure 4-1). We believe that most of this energy is dissipated without disturbing Ekin,impact (nJ) assembled components because components typically have a trajectory that is nearly orthogonal to the substrate surface. Instead, we investigate the velocity component in horizontal direction as the cause of the repairing or expelling process. While a detailed analysis of the directional distributions of velocity vectors is beyond the scope of this paper, we consider the tilt angle (up to 22º) of the diaphragm and estimate the horizontal velocity component at impact reduced by a factor of sin(22º). Accordingly, we obtain an adjusted maximum kinetic energy at impact decreased by sin2(22º) (Figure 4-2). This calculation shows our experiments are within a reasonable range of repairing the unwanted vertical alignment without interfering with the correct horizontal alignment. 4. BINDING AND ANNEALING Capillarity aligns a component to the binding site once it is captured by the droplet on the site (Figure 5-1). This self-alignment phenomenon is the result of minimization of interfacial energy between the liquid bridge and air. Two major failure modes can be observed during this process: vertical and horizontal misalignment (Figure 5-2). Vertical misalignment is caused by improper side-contact between components and binding sites. Horizontal disorientation is caused by “polygamous” binding between two components and one site. A significant advantage of our approach is that these failures are self-correcting: when other components hit a disoriented component, it is dislodged or adjusted (Fig. (1) (2) 1mm 28.8 f (Hz) V (V) Ekin,impact (nJ) Figure 5: (1) A correctly self-assembled array. (2) Incorrectly assembled vertical parts. A 28.8 B C f (Hz) D V (V) Figure 4: (1) The maximum impact energy Ekin,impact is calculated and compared with surface energy of vertical alignment (28.8 nJ). (2) Ekin,impact obtained from the horizontal velocity component, considering a tilt angle of the diaphragm of up to 22º. Note that 28.8nJ < Ekin,impact < 144nJ when f≈240Hz and V≈4V. 22.92s 23.59s 23.65s 23.69s 23.72s 23.85s Figure 6: Video frames from an assembly experiment. One column of the array shows: (A) alignment driven by surface tension, (B,D) correctly aligned components, (C) vertical attachment being corrected by impacts. 6-C). This is possible because incorrect assemblies require less energy to be dislodged (Table 1-2). (1) (2) 5. ANALYSIS Our experimental results show that assembly rate and yield ratios are mainly determined by impact energy and component density. Higher impact energy and component density lead to higher yield ratio and assembly rate (Fig. 7). Yield Ratio(%) 100 274nJ 352nJ 450nJ 668nJ >700nJ 80 60 (3) 40 6. CONCLUSION 20 0 0 5 10 15 20 25 Time(Sec) Figure 7: The yield ratio obtained at different maximum impact energies. Signal was created at 240Hz and substrate distance from the speaker remained at 12mm. For assembly of square silicon components, a simple yield test with a 4×4 square array of binding sites has been evaluated. We achieve 93% yield ratio within 30sec under impact energy larger than 700nJ, with the supply of 100 components. Released actuators on 2.5mm square SOI chiplets were used to test potential damage during diaphragm agitation. Both linear and rotation comb drives were tested (4V applied voltage and 240Hz frequency), and worked after the process. No damages were found on the fixed and suspended structures (cross section 10µm×2µm) of the linear comb drive (Fig. 8). The rotation comb drive with 2µm×2µm cross-sectional fingers suffered from slight damage (Fig. 9). (1) Figure 9: (1) 2.5mm square SOI parts with actuators. (2) SEM of the rotation comb drive. (3) After the self-assembly process, the actuators still work. Two fixed comb fingers were broken while the floating parts remain undamaged. 2.5mm Figure 8: (1) 2.5mm square SOI parts with comb drives (device side thickness: 10µm, handle side thickness: 525µm). (2) SEM micrograph of the comb drive (suspension beam length: 530µm, width: 3µm, thickness: 10 µm). (3) After the self-assembly process, the actuators still work. No damage was observed. (2) (3) Self-assembly by diaphragm agitation demonstrates a fast, high-yield, self-correcting, in-air process. Possible extensions of this work include (1) multi-batch assemblies with shadow masks blocking specific undesired sites in each batch, and (2) 3-D assemblies by stacking up components on top of each other. Future work includes: 1. Avoiding the device side of MEMS chips to bind to droplets. Patterning thick-layer protection structures next to the device can prevent devices from touching the droplet. Due to the small surface area of assembly, these components would be repaired by the self-correcting process. 2. Permanent bonding between the components and the binding sites can be achieved by coating low temperature alloy on the binding site prior to the assembly. After the water droplets dry out, melted alloy can be used to form bonds. Patterning heaters on the binding site allows us to further program the self-assembly process by controlling which sites will permanently bond the components. REFERENCES [1] X. Xiong, Y. Hanein, J. Fang, Y. Wang, W. Wang, D. T. Schwartz, K. F. Böhringer, JMEMS 12(2):117-127, 2003. [2] U. Srinivasan, M. H. Helmbrecht, C. Rembe, R. S. Muller, R. T. Howe, J. Sel. Topics Quantum El. 8(1):4-11, 2002. [3] U. Srinivasan, R. T. Howe, D. Liepmann, Int. Conf. Solid-State Sensors & Actuators, 1170-1173, 1999. [4] A. Terfort, N. Bowden, G. M. Whitesides, Nature 386:162-164, 1997. [5] H. J. Yeh and J. S. Smith, IEEE Photonics Technology Letters 46:706-708, 1994. [6] H. Onoe, K. Matsumoto, I. Shimoyama, JMEMS 13(4):603-611, 2004. [7] K. F. Böhringer, U. Srinivasan, R. T. Howe, IEEE Int. Conf. MEMS, pp.369-374, 2001. Acknowledgement: This work was supported by DARPA DSO award FA9550-04-1-0257 and by US Department of Justice award 2000-DT-CX-K001.


