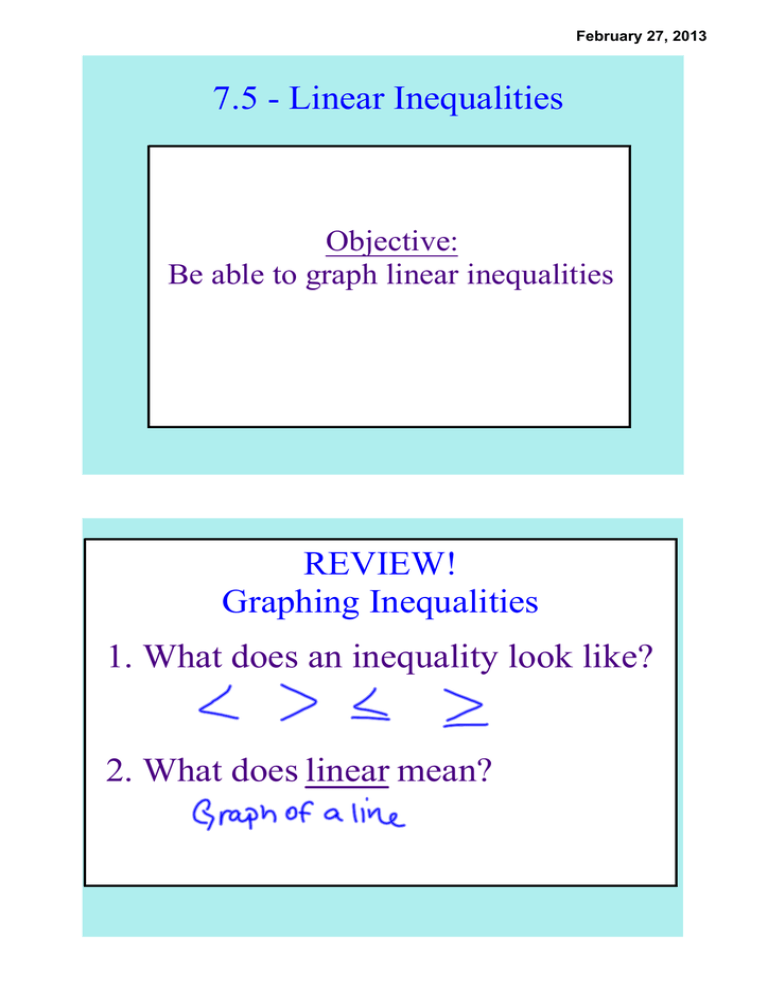
7.5 Linear Inequalities REVIEW! Graphing Inequalities 1. What does an inequality look like?
advertisement

February 27, 2013 7.5 ­ Linear Inequalities Objective: Be able to graph linear inequalities REVIEW! Graphing Inequalities 1. What does an inequality look like? 2. What does linear mean? February 27, 2013 REVIEW! Graphing Inequalities x > ­1 ­5 ­1 ­2 ­3 ­4 1 0 2 3 5 4 x < ­1 ­5 ­1 ­2 ­3 ­4 0 1 2 3 5 4 REVIEW: Solving Inequalities 3x + 4 > 16 It works just like an equation! Solve it like normal! Always remember to graph it afterwards! ­5 ­4 ­3 ­2 ­1 0 1 2 3 4 5 February 27, 2013 Here's the only difference! When we MULTIPLY OR DIVIDE BY A NEGATIVE, we switch the sign of our inequality! 1. Get x by itself by adding/subtracting constants. 2. If we divide/multiply by a negative, switch our inequality sign. 3. Graph the final answer! REVIEW: Solving Inequalities ­7x < 42 Always remember to graph it afterwards! February 27, 2013 REVIEW: Solving Inequalities ­2x ­ 4x > 14 Always remember to graph it afterwards! February 27, 2013 Linear Inequalities Example: 1. y < 2x + 3 February 27, 2013 Example: 2. y > 2 Example: 3. 3x ­ 5y < 10 February 27, 2013 Must be checked off by me: 4. x > 3 5. y < ­3x + 1 6. ­2y < 8x ­6 Homework #19: Graphing Inequalities WS Chapter 7 Test March 8th! (NEXT Friday)


