Impedance Matching Concepts in RFID Transponder Design
advertisement
Impedance Matching Concepts in RFID Transponder Design
K. V. S. Rao, Pavel V. Nikitin, Sander F. Lam
Intermec Technologies Corporation
6001 36th Ave W
Everett, WA 98203, USA
Email: {kvs.rao, pavel.nikitin, sander.lam}@intermec.com
Abstract
In this paper, we analyze impedance matching concepts
in passive radio frequency identification (RFID) transponders, which are powered by the incoming RF energy and
consist of an antenna and an integrated circuit chip, both
with complex impedances.
The impedance match between the chip and the antenna
can be characterized by the power transmission coefficient.
We analyze the behavior of the power transmission coefficient and the effect it has on the tag performance.
As an example, we consider a specific RFID transponder
design, an Intellitag ID card with embedded folded meander antenna operating in 915 MHz band. We present both
measurement data and simulation results, which are in good
agreement.
1 Introduction
RFID is a rapidly developing automatic identification
technology [5, 1]. Although the basic principles of passive
RFID technology were developed soon after Wold War II,
it took nearly half a century before RFID technology advanced to today’s level.
A typical back-scattered RFID transponder (tag) consists
of an antenna and an integrated circuit (chip). The chip is
usually placed right at the terminals of the tag antenna, and
both chip and antenna have complex input impedances.
The system operates in the following way. Base station module (RFID reader) transmits an RF signal, which
is received by an RFID tag antenna. The voltage developed
on antenna terminals powers up the chip, which sends the
information back by varying its input impedance and thus
modulating the backscattered signal.
Proper impedance match between the antenna and the
chip is of paramount importance in RFID [6]. It greatly
determines important RFID tag characteristics, such as tag
read range [2]. Impedance match can be characterized by
the power transmission coefficient whose behavior determines tag performance and can be analyzed as shown below. A specific RFID tag design example with modeling
and simulation results which agree with measurement data
is also presented as an illustration of the analysis.
2 Impedance Matching
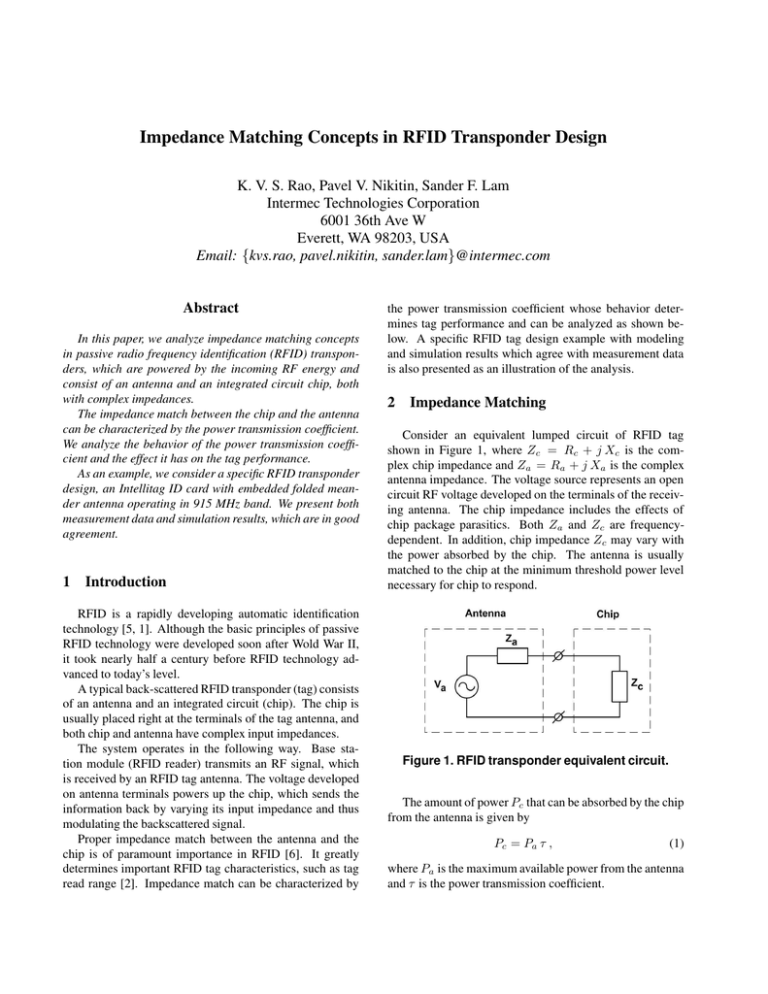
Consider an equivalent lumped circuit of RFID tag
shown in Figure 1, where Zc = Rc + j Xc is the complex chip impedance and Za = Ra + j Xa is the complex
antenna impedance. The voltage source represents an open
circuit RF voltage developed on the terminals of the receiving antenna. The chip impedance includes the effects of
chip package parasitics. Both Za and Zc are frequencydependent. In addition, chip impedance Zc may vary with
the power absorbed by the chip. The antenna is usually
matched to the chip at the minimum threshold power level
necessary for chip to respond.
Figure 1. RFID transponder equivalent circuit.
The amount of power Pc that can be absorbed by the chip
from the antenna is given by
Pc = Pa τ ,
(1)
where Pa is the maximum available power from the antenna
and τ is the power transmission coefficient.
Pa is the power that can be dissipated at the chip when
Zc = Za∗ . The power transmission coefficient τ is given by
τ=
4Rc Ra
|Zc + Za |2
(2)
and can be plotted directly in complex impedance plane as
shown below. The power transmission coefficient τ directly
characterizes the degree of impedance match between the
chip and the antenna.
Normalizing Equation 2 by Rc2 allows one to obtain
τ=
4ra
,
|1 + ra + jQ(1 + xa )|2
(3)
where ra = Ra /Rc is normalized antenna resistance, xa =
Xa /Xc is normalized antenna reactance, and Q = Xc /Rc
is the resonant factor of the chip for the given frequency and
absorbed power. Antenna impedance can be normalized to
the chip impedance because an RFID tag antenna is usually
matched to a given RFID chip.
After several straightforward mathematical transformations, Equation 3 can be expressed as
2
2
[ra − (2/τ − 1)] + Q2 [xa + 1] =
4
(1 − τ ) .
τ2
(4)
One can see that Equation 4 describes an ellipse with the aspect ratio Q and center located at a point {(2/τ − 1), −1}.
Figure 2 shows the contours of constant τ given by Equation 4 for two different values of Q.
Since Za and Zc are both frequency-dependent, both aspect ratio and foci of ellipses are also frequency-dependent.
At a given frequency and power into the chip, any antenna
impedance Za corresponds to a unique point {ra , xa } and
hence to a particular value of τ , determined by the ellipse
passing through that point.
The contours shown in Figure 2 are a good illustration
for impedance matching in RFID transponder. The smaller
is the ellipse, the higher is the value of the power transmission coefficient. The point of perfect complex conjugate
impedance match between the antenna and the chip is the
point where τ = 1.
3 Transponder Range
One of the most important characteristics of RFID tag is
its read range. One limitation on the range is the maximum
distance at which tag receives just enough power to turn on
and scatter back. Another limitation is the maximum distance at which reader can detect this scattered signal. The
read range is the smaller of the two distances. Typically,
reader sensitivity is high enough so read range is determined
by the former distance.
In free-space propagation environment, the power received by an RFID antenna can be calculated using Friis
free-space equation as:
Pa = Pt Gt Gr
Q=10
Q=20
−0.4
−0.6
x
a
−0.8
−1
τ=1
τ=0.75
τ=0.5
τ=0.25
−1.2
−1.6
0
5
10
15
ra
Figure 2. Contours of constant power transmission coefficient τ on normalized antenna
impedance plane.
2
,
(5)
where Pt is the power transmitted by the reader, Gt is the
gain of the reader antenna, Gr is the gain of the receiving
tag antenna, λ is the wavelength, and d is the distance between the reader and the tag.
If the minimum threshold power necessary to power up
the chip is Pth , then read range r can be calculated as
λ
r=
4π
−1.4
λ
4πd
Pt
Gt Gr τ .
Pth
(6)
The peak of the range in the frequency domain can be referred to as tag resonance. Typically Pt , Pth , Gt , and Gr
are slow-varying, and τ is dominant in frequency dependence and primarily determines the tag resonance.
The read range in Equation 6 can be normalized to the
maximum possible range of the tag when it is perfectly
matched to the chip (τ = 1). Such normalization allows
designer to see what improvement in read range can be obtained by better impedance matching. For example for the
tag in Figure 4, impedance matching with τ = 0.5 corresponds to about 70% of the maximum attainable read range.
80
60
40
20
0
0
Figure 5. RFID transponder inside Intellitag ID
card.
0.2
0.4
0.6
0.8
Power transmission coefficient
1
Figure 3. Normalized read range vs. power
transmission coefficient.
4 Design Example
Consider a specific design example: the Intellitag ID
card developed by Intermec Technologies Corporation [4]
and shown in Figure 4. This credit card format RFID tag
was designed for security access and control applications.
This tag is currently used for expedited border crossings between the United States and Canada.
Figure 4. Intellitag ID card.
The transponder consists of an RFID chip connected to
a folded meander copper antenna printed on 4 mil FR4 substrate (the copper trace area is 70 mm by 22 mm) as shown
in Figure 5. This transponder was designed to operate in
915 MHz band after being embedded into a plastic card
(blank or with magnetic striping).
In this tag, Fairchild RFID ASIC chip [3] was used.
The chip was mounted on antenna terminals using flip-chip
packaging. The input impedance of the packaged chip was
measured in the frequency domain with the network analyzer for different power levels. It was determined with
RFID reader that the minimum power needed by the chip to
turn on was -9 dBm and that the packaged chip impedance
was Zc = 15 − j 420 Ohm.
This antenna was designed using electromagnetic (EM)
simulation tool Ansoft Designer, which allowed us to calculate antenna gain and impedance and match it to the chip.
The antenna was designed so that the tag resonates in freespace at about 965 MHz. This ensures that when the tag is
placed inside plastic card, its resonant frequency shifts to
915 MHz band.
The power transmission coefficient for this antenna
in free-space is given in Figure 6 as a function of frequency. It was calculated from Equation 2 where chip
impedance value was measured as described above and antenna impedance was obtained from EM simulations.
Power transmission coefficient
Read range (percent)
100
0.5
0.4
Free−space
resonant
frequency
0.3
0.2
0.1
0
920
940
960
980
Frequency (MHz)
1000
1020
Figure 6. Power transmission coefficient of
RFID transponder in Figure 5 in free space.
5 Experimental Results
4
Range (m)
The tag read range was measured as illustrated in Figure 7. The tag was placed in an anechoic chamber at a fixed
distance from the linearly polarized reader antenna. The tag
face was normal to the antenna centerline and oriented in
the direction of best polarization match. The distance to the
tag (0.9 m) was selected such that the tag would respond
and be located both in far field. At each frequency, the minimum transmitter power Pt required to communicate with
the tag was recorded by using controlled attenuation on the
output of RFID reader.
5
In free space (theory)
In free space (data)
Inside plastic card (theory)
Inside plastic card (data)
3
2
1
0
850
900
950
Frequency (MHz)
1000
Figure 8. Theoretical and experimental read
range of RFID transponder shown in Figure 5
(EIRP=4 W).
Figure 7. Tag range measurement setup.
Since the gain of the transmitting antenna, the separation
distance, and the cable loss were known (d = 0.9 m, Gt =
6.2 dBi, L = −0.5 dB), the tag read range for a given EIRP
was calculated from Equation 6 as:
EIRP
.
(7)
r=d
Pt Gt L
Figure 8 presents a comparison between theoretical and
experimentally measured read range for our RFID transponder. Antenna gain Gr and impedance Za were calculated
using Ansoft Designer, and chip impedance Zc was measured as described above.
It can be seen that theoretical curves and experimental
data are in good agreement. It can also be seen that the read
range in free-space reaches maximum at the same frequency
as the free-space power transmission coefficient shown in
Figure 6.
When RFID transponder is placed inside plastic card, antenna properties change and tag resonant frequency shifts
from 965 MHz to 915 MHz.
6 Conclusions
In this paper, we analyzed impedance matching concepts
in RFID tags, in which both antenna and chip have complex
impedances. The impedance match can be characterized by
the power transmission coefficient. We analyzed a behavior
of the power transmission coefficient and the effect it has on
tag performance.
We presented a specific RFID tag example and showed
that the tag resonance is determined by the peak in the
power transmission coefficient. The experimentally measured read range agreed well with the theoretical model.
7 Acknowledgements
The authors would like to thank their colleague Mr.
Thomas Miller for his interest in this work.
References
[1] K. Finkenzeller. RFID handbook: Radio-frequency identification fundamentals and applications. John Wiley and Sons,
1999.
[2] P. R. Foster and R. A. Burberry. Antenna problems in RFID
systems. IEE Colloquium on RFID Technology, pages 3/1–
3/5, October 1999.
[3] http://www.fairchildsemi.com.
[4] http://www.intermec.com.
[5] K. V. S. Rao. An overview of backscattered radio frequency
identification system (RFID). Asia Pacific Microwave Conference, 3:746–749, November-December 1999.
[6] Y. Tikhov and J. H. Won. Impedance-matching arrangement
for microwave transponder operating over plurality of bent installations of antenna. Electronics Letters, 40:574–575, May
2004.
