Document 10825194
advertisement
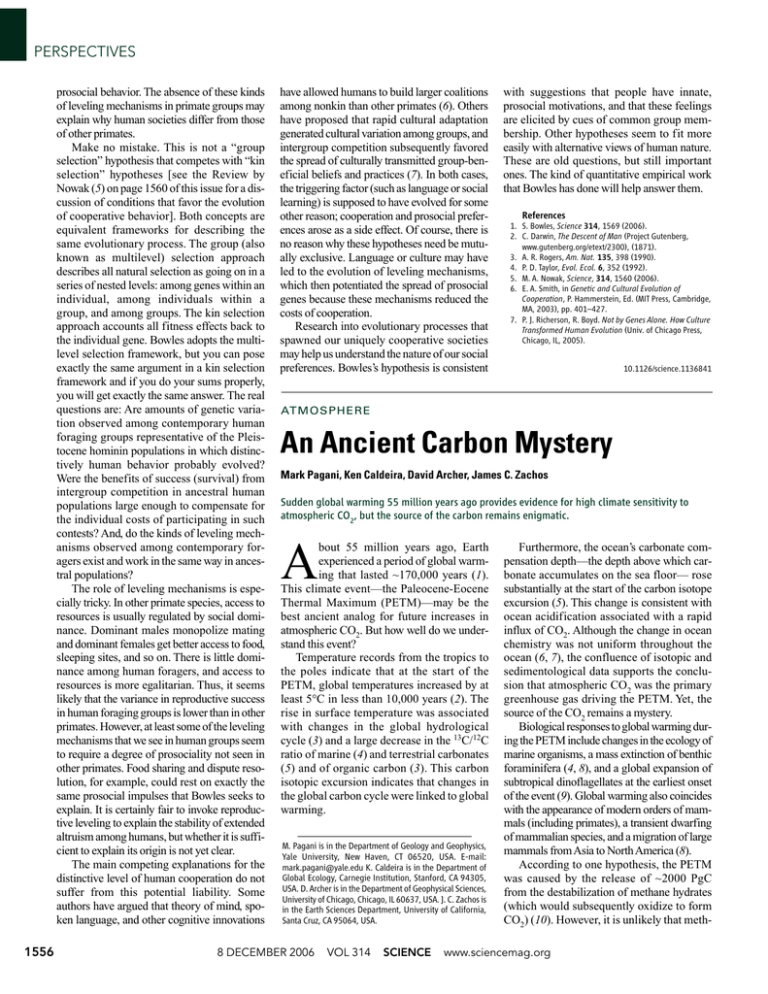
PERSPECTIVES prosocial behavior. The absence of these kinds of leveling mechanisms in primate groups may explain why human societies differ from those of other primates. Make no mistake. This is not a “group selection” hypothesis that competes with “kin selection” hypotheses [see the Review by Nowak (5) on page 1560 of this issue for a discussion of conditions that favor the evolution of cooperative behavior]. Both concepts are equivalent frameworks for describing the same evolutionary process. The group (also known as multilevel) selection approach describes all natural selection as going on in a series of nested levels: among genes within an individual, among individuals within a group, and among groups. The kin selection approach accounts all fitness effects back to the individual gene. Bowles adopts the multilevel selection framework, but you can pose exactly the same argument in a kin selection framework and if you do your sums properly, you will get exactly the same answer. The real questions are: Are amounts of genetic variation observed among contemporary human foraging groups representative of the Pleistocene hominin populations in which distinctively human behavior probably evolved? Were the benefits of success (survival) from intergroup competition in ancestral human populations large enough to compensate for the individual costs of participating in such contests? And, do the kinds of leveling mechanisms observed among contemporary foragers exist and work in the same way in ancestral populations? The role of leveling mechanisms is especially tricky. In other primate species, access to resources is usually regulated by social dominance. Dominant males monopolize mating and dominant females get better access to food, sleeping sites, and so on. There is little dominance among human foragers, and access to resources is more egalitarian. Thus, it seems likely that the variance in reproductive success in human foraging groups is lower than in other primates. However, at least some of the leveling mechanisms that we see in human groups seem to require a degree of prosociality not seen in other primates. Food sharing and dispute resolution, for example, could rest on exactly the same prosocial impulses that Bowles seeks to explain. It is certainly fair to invoke reproductive leveling to explain the stability of extended altruism among humans, but whether it is sufficient to explain its origin is not yet clear. The main competing explanations for the distinctive level of human cooperation do not suffer from this potential liability. Some authors have argued that theory of mind, spoken language, and other cognitive innovations 1556 have allowed humans to build larger coalitions among nonkin than other primates (6). Others have proposed that rapid cultural adaptation generated cultural variation among groups, and intergroup competition subsequently favored the spread of culturally transmitted group-beneficial beliefs and practices (7). In both cases, the triggering factor (such as language or social learning) is supposed to have evolved for some other reason; cooperation and prosocial preferences arose as a side effect. Of course, there is no reason why these hypotheses need be mutually exclusive. Language or culture may have led to the evolution of leveling mechanisms, which then potentiated the spread of prosocial genes because these mechanisms reduced the costs of cooperation. Research into evolutionary processes that spawned our uniquely cooperative societies may help us understand the nature of our social preferences. Bowles’s hypothesis is consistent with suggestions that people have innate, prosocial motivations, and that these feelings are elicited by cues of common group membership. Other hypotheses seem to fit more easily with alternative views of human nature. These are old questions, but still important ones. The kind of quantitative empirical work that Bowles has done will help answer them. References 1. S. Bowles, Science 314, 1569 (2006). 2. C. Darwin, The Descent of Man (Project Gutenberg, www.gutenberg.org/etext/2300), (1871). 3. A. R. Rogers, Am. Nat. 135, 398 (1990). 4. P. D. Taylor, Evol. Ecol. 6, 352 (1992). 5. M. A. Nowak, Science, 314, 1560 (2006). 6. E. A. Smith, in Genetic and Cultural Evolution of Cooperation, P. Hammerstein, Ed. (MIT Press, Cambridge, MA, 2003), pp. 401–427. 7. P. J. Richerson, R. Boyd. Not by Genes Alone. How Culture Transformed Human Evolution (Univ. of Chicago Press, Chicago, IL, 2005). 10.1126/science.1136841 ATMOSPHERE An Ancient Carbon Mystery Mark Pagani, Ken Caldeira, David Archer, James C. Zachos Sudden global warming 55 million years ago provides evidence for high climate sensitivity to atmospheric CO2, but the source of the carbon remains enigmatic. bout 55 million years ago, Earth experienced a period of global warming that lasted ~170,000 years (1). This climate event—the Paleocene-Eocene Thermal Maximum (PETM)—may be the best ancient analog for future increases in atmospheric CO2. But how well do we understand this event? Temperature records from the tropics to the poles indicate that at the start of the PETM, global temperatures increased by at least 5°C in less than 10,000 years (2). The rise in surface temperature was associated with changes in the global hydrological cycle (3) and a large decrease in the 13C/12C ratio of marine (4) and terrestrial carbonates (5) and of organic carbon (3). This carbon isotopic excursion indicates that changes in the global carbon cycle were linked to global warming. A M. Pagani is in the Department of Geology and Geophysics, Yale University, New Haven, CT 06520, USA. E-mail: mark.pagani@yale.edu K. Caldeira is in the Department of Global Ecology, Carnegie Institution, Stanford, CA 94305, USA. D. Archer is in the Department of Geophysical Sciences, University of Chicago, Chicago, IL 60637, USA. J. C. Zachos is in the Earth Sciences Department, University of California, Santa Cruz, CA 95064, USA. 8 DECEMBER 2006 VOL 314 SCIENCE Furthermore, the ocean’s carbonate compensation depth—the depth above which carbonate accumulates on the sea floor— rose substantially at the start of the carbon isotope excursion (5). This change is consistent with ocean acidification associated with a rapid influx of CO2. Although the change in ocean chemistry was not uniform throughout the ocean (6, 7), the confluence of isotopic and sedimentological data supports the conclusion that atmospheric CO2 was the primary greenhouse gas driving the PETM. Yet, the source of the CO2 remains a mystery. Biological responses to global warming during the PETM include changes in the ecology of marine organisms, a mass extinction of benthic foraminifera (4, 8), and a global expansion of subtropical dinoflagellates at the earliest onset of the event (9). Global warming also coincides with the appearance of modern orders of mammals (including primates), a transient dwarfing of mammalian species, and a migration of large mammals from Asia to North America (8). According to one hypothesis, the PETM was caused by the release of ~2000 PgC from the destabilization of methane hydrates (which would subsequently oxidize to form CO2) (10). However, it is unlikely that meth- www.sciencemag.org PERSPECTIVES 30 55,000 Pg more C in atmosphere at 1.5ºC/doubling 20 40 During PETM 10 20 1500 Pg more C in atmosphere at 4.5ºC/doubling Atmospheric CO2 concentration (Thousands of ppm) Before PETM 0 0 2.5˚C 1.5˚C Climate sensitivity to CO2 doubling ane was the sole source of warming. For example, the size of the methane hydrate reservoir at the end of the Paleocene was probably much smaller than it is today (11), and the magnitude of the sustained warming and the change in the carbonate compensation depth are compatible with a much greater mass of carbon than originally estimated (6). To account for larger carbon inputs, other sources have been invoked, including the oxidation of terrestrial (12) and marine (13) organic carbon and/or volcanic outgassing and thermal decomposition of organic matter (14). There is no single satisfactory explanation. But whatever the source, the carbon input responsible for the PETM must have been massive. Given a global temperature sensitivity range of 1.5 to 4.5°C per doubling of the atmospheric CO2 concentration and global mean annual temperatures perhaps 5°C warmer than during recent pre-industrial times, estimates for pre-PETM atmospheric CO2 concentrations range from 600 to 2800 parts per million (ppm), broadly consistent 4.5˚C 9.5˚C 8.5˚C 7.5˚C 6.5˚C 5.5˚C Climate sensitivity to CO2 doubling 13 –10 –20 Terrestrial/marine organic carbon –30 -5‰ -3‰ –40 –50 –60 Methane –70 1 3 10 30 100 –1 –2 –3 –4 –5 –6 –7 Carbon isotopic excursion (‰) 0 ␦ C of released carbon (‰, PDB) Carbon release during the PETM. The amount of carbon needed to explain a 5°C change in global mean temperature depends on pre-PETM CO2 conditions (see the first figure) and the climate sensitivity to CO2 doubling (including associated system feedbacks). The source of carbon released (and climate sensitivity) can be estimated from the carbon isotopic composition of the released carbon and the δ13C excursion it produced. For example, assuming a carbon isotope excursion of –3 to –5‰, carbon from methane (with an average δ13C value of –60‰, green bar) would imply a carbon input of 1800 to 3500 PgC and a climate sensitivity of 6.8 to 7.8°C per CO2 doubling. Terrestrial/marine organic carbon refers to organic carbon derived from the primary production of terrestrial and/or marine plants. with estimates from proxy data (15). Starting from these conditions, an increase of 750 to 26,000 ppm of atmospheric CO2 would be required to account for an additional 5°C rise in global temperature, which implies an addition of 1500 to 55,000 PgC to the atmosphere alone (see the first figure). Sustaining this concentration for tens of thousands of years implies partial equilibration with the carbonate system in the ocean, indicating a total release of 5400 to 112,000 PgC (see the second figure), with 3900 to 57,000 PgC of released carbon residing in the ocean (and with additional carbon supplied by the dissolution of carbonates). The extraordinary magnitude of these estimates is evident when compared against the 5000 PgC estimated for conventional fossil fuel resources available today. The input of carbon responsible for the PETM altered the stable carbon isotopic composition of the Eocene oceans and atmosphere. Marine carbonate records indicate a carbon isotope excursion between –2.5 and –3 per mil (‰), but records from ancient soil car1.5˚C 3.5˚C 2.5˚C 4.5˚C CO2 input during the PETM. The amount of additional atmospheric CO2 responsible for the PETM warming depends on the pre-PETM atmospheric CO2 concentration and the climate sensitivity to CO2 doubling. To determine pre-PETM atmospheric CO2 concentrations (blue line), we assumed pre-PETM global mean annual temperature 5°C warmer than during recent pre-industrial times, when atmospheric CO2 concentrations were 280 ppm. To determine PETM atmospheric CO2 concentrations (orange line), we assumed a 5°C warming during the PETM and a surface ocean 5× saturated with respect to calcite. 3.5˚C Carbon in the atmosphere (Thousands of Pg) 60 bonates and plant organic matter reveal a much larger change of over –5‰ (3, 5). Explanations have been presented to account for these isotopic differences (5), but this evidence can also suggest that the global carbon isotope excursion was larger than determined from marine carbonates (3). These details may appear esoteric, but to determine the mass and source of carbon responsible for the >5°C warming during the PETM, we must match the magnitude of the carbon isotope excursion with the mean global temperature sensitivity to CO2 and associated climate feedbacks (see the figures). One conclusion from this approach is that CO2 derived from methane hydrates could only have caused the PETM if the climate sensitivity to CO2 was much higher than currently assumed. Yet carbon sources other than methane, such as the oxidation of primary terrestrial and/or marine organic carbon, together with commonly accepted estimates of climate sensitivity, would require extremely large carbon inputs to explain the warming. Thus, the PETM either resulted from an enormous input of CO2 that currently defies a mechanistic explanation, or climate sensitivity to CO2 was extremely high. The next challenges are to constrain the magnitude and rate of carbon input (and that of other greenhouse gases) and to develop realistic models for the cause of this anomalous, but clearly CO2-induced global warming event. Solving this mystery will allow us to determine whether the PETM is a true analog for future climate change. References 1. U. Rohl, T. K J. Bralower, R. D. Norris, G. Wefer, Geology 28, 927 (2000). 2. A. Sluijs et al., Nature 441, 610 (2006). 3. M. Pagani et al., Nature 442 671 (2006). 4. E. Thomas, N. J. Shackleton, in Correlation of the Early Paleogene in Northwest Europe, R. W. O. Knox et al., Eds. (Special Publication 101, Geological Society, London, UK, 1996), pp. 401–441. 5. G. J. Bowen, D. J. Beerling, P. L. Koch, J. C. Zachos, T. Quattlebaum, Nature 432, 495 (2004). 6. J. C. Zachos et al., Science 308, 1611 (2005). 7. D. J. Thomas, J. C. Zachos, T. J. Bralower, E. Thomas, S. Bohaty, Geology 30, 1067 (2002). 8. S. L. Wing et al., Eds., Causes and Consequences of Globally Warm Climates in the Early Paleogene, Geological Society of America special paper 369 (2003). 9. M. Crouch, Palaeogeogr., Palaeoclimatol., Palaeoecol. 194, 387 (2003). 10. G. R. Dickens, J. R. O’Neil, D. K. Rea, R. M. Owen, Paleoceanography 10, 965 (1995). 11. B. Buffett, D. Archer, Earth Planet. Sci. Lett. 227, 185 (2004). 12. A. C. Kurtz, L. R. Kump, M. A. Arthur, J. C. Zachos, A. Paytan, Paleoceanography 18, 1090 (2003). 13. J. A. Higgins, D. P. Schrag, Earth Planet. Sci. Lett. 245, 523 (2006). 14. H. Svensen et al., Nature 429, 542 (2004). 15. M. Pagani, J. C. Zachos, K. H. Freeman, B. Tipple, S. Bohaty, Science 309, 600 (2005). Amount of carbon released (Thousands of PgC) www.sciencemag.org SCIENCE VOL 314 10.1126/science.1136110 8 DECEMBER 2006 1557


