Assignment: Population Name: 1. Understand the statistical descriptions of population below.
advertisement
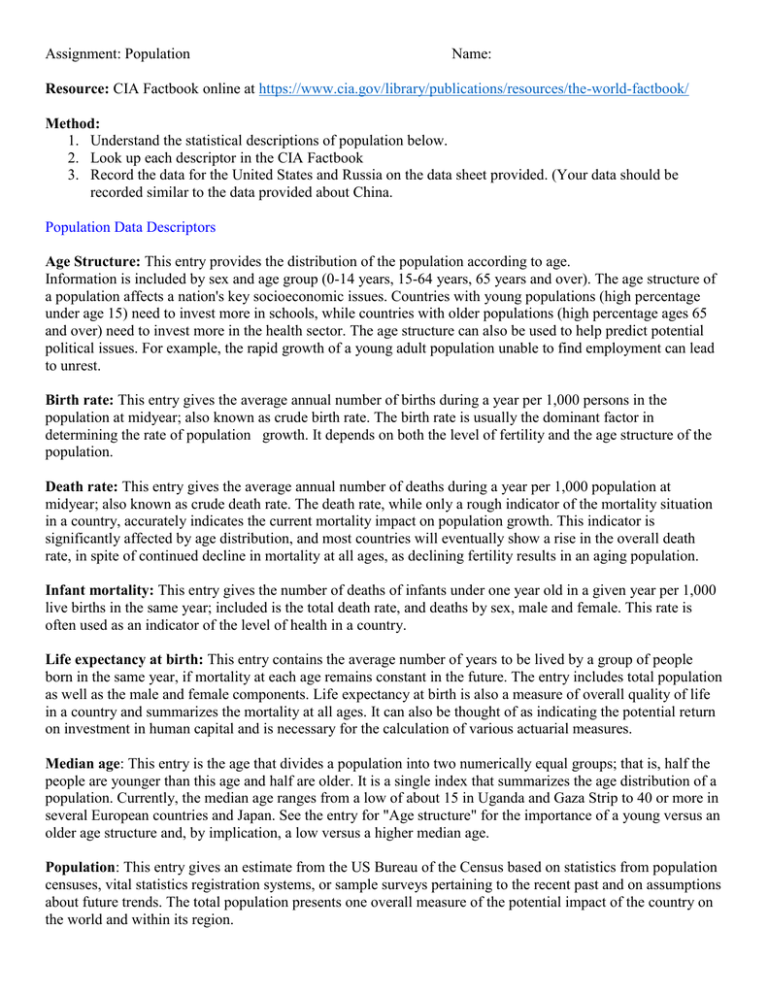
Assignment: Population Name: Resource: CIA Factbook online at https://www.cia.gov/library/publications/resources/the-world-factbook/ Method: 1. Understand the statistical descriptions of population below. 2. Look up each descriptor in the CIA Factbook 3. Record the data for the United States and Russia on the data sheet provided. (Your data should be recorded similar to the data provided about China. Population Data Descriptors Age Structure: This entry provides the distribution of the population according to age. Information is included by sex and age group (0-14 years, 15-64 years, 65 years and over). The age structure of a population affects a nation's key socioeconomic issues. Countries with young populations (high percentage under age 15) need to invest more in schools, while countries with older populations (high percentage ages 65 and over) need to invest more in the health sector. The age structure can also be used to help predict potential political issues. For example, the rapid growth of a young adult population unable to find employment can lead to unrest. Birth rate: This entry gives the average annual number of births during a year per 1,000 persons in the population at midyear; also known as crude birth rate. The birth rate is usually the dominant factor in determining the rate of population growth. It depends on both the level of fertility and the age structure of the population. Death rate: This entry gives the average annual number of deaths during a year per 1,000 population at midyear; also known as crude death rate. The death rate, while only a rough indicator of the mortality situation in a country, accurately indicates the current mortality impact on population growth. This indicator is significantly affected by age distribution, and most countries will eventually show a rise in the overall death rate, in spite of continued decline in mortality at all ages, as declining fertility results in an aging population. Infant mortality: This entry gives the number of deaths of infants under one year old in a given year per 1,000 live births in the same year; included is the total death rate, and deaths by sex, male and female. This rate is often used as an indicator of the level of health in a country. Life expectancy at birth: This entry contains the average number of years to be lived by a group of people born in the same year, if mortality at each age remains constant in the future. The entry includes total population as well as the male and female components. Life expectancy at birth is also a measure of overall quality of life in a country and summarizes the mortality at all ages. It can also be thought of as indicating the potential return on investment in human capital and is necessary for the calculation of various actuarial measures. Median age: This entry is the age that divides a population into two numerically equal groups; that is, half the people are younger than this age and half are older. It is a single index that summarizes the age distribution of a population. Currently, the median age ranges from a low of about 15 in Uganda and Gaza Strip to 40 or more in several European countries and Japan. See the entry for "Age structure" for the importance of a young versus an older age structure and, by implication, a low versus a higher median age. Population: This entry gives an estimate from the US Bureau of the Census based on statistics from population censuses, vital statistics registration systems, or sample surveys pertaining to the recent past and on assumptions about future trends. The total population presents one overall measure of the potential impact of the country on the world and within its region. Population growth rate: The average annual percent change in the population, resulting from a surplus (or deficit) of births over deaths and the balance of migrants entering and leaving a country. The rate may be positive or negative. The growth rate is a factor in determining how great a burden would be imposed on a country by the changing needs of its people for infrastructure (e.g., schools, hospitals, housing, roads), resources (e.g., food, water, electricity), and jobs. Rapid population growth can be seen as threatening by neighboring countries. Total fertility rate: This entry gives a figure for the average number of children that would be born per woman if all women lived to the end of their childbearing years and bore children according to a given fertility rate at each age. The total fertility rate (TFR) is a more direct measure of the level of fertility than the crude birth rate, since it refers to births per woman. This indicator shows the potential for population change in the country. A rate of two children per woman is considered the replacement rate for a population, resulting in relative stability in terms of total numbers. Rates above two children indicate populations growing in size and whose median age is declining. Higher rates may also indicate difficulties for families, in some situations, to feed and educate their children and for women to enter the labor force. Rates below two children indicate populations decreasing in size and growing older. Global fertility rates are in general decline and this trend is most pronounced in industrialized countries, especially Western Europe, where populations are projected to decline dramatically over the next 50 years. Refugees and internally displaced persons: This entry includes those persons residing in a country as refugees or internally displaced persons (IDPs). The definition of a refugee according to a United Nations Convention is "a person who is outside his/her country of nationality or habitual residence; has a well-founded fear of persecution because of his/her race, religion, nationality, membership in a particular social group or political opinion; and is unable or unwilling to avail himself/herself of the protection of that country, or to return there, for fear of persecution." The term "internally displaced person" is not specifically covered in the UN Convention; it is used to describe people who have fled their homes for reasons similar to refugees, but who remain within their own national territory and are subject to the laws of that state. Ethnic groups: This entry provides an ordered listing of ethnic groups starting with the largest and normally includes the percent of total population. Population Descriptor Age Structure Birth Rate Death Rate Infant Mortality Life Expectancy at birth China 0-14 years: 20.4% 15-64 years: 71.7% 65 years and over: 7.9% 13.45 births/1,000 population 7 deaths/1,000 population total: 22.12 deaths/1,000 live births male: 20.01 deaths/1,000 live births female: 24.47 deaths/1,000 live births (2007 est.) total population: 72.88 years male: 71.13 years female: 74.82 years (2007 USA Russia Median Age Population Population Growth Fertility Rate Refugees and internally displaced persons Ethnic Groups est.) total: 33.2 years male: 32.7 years female: 33.7 years (2007 est.) 1,321,851,888 (July 2007 est.) 0.606% (2007 est.) 1.75 children born/woman (2007 est.) 300,897 (Vietnam), estimated 30,000-50,000 (North Korea) IDPs: 90,000 (2006) Han Chinese 91.9% Zhuang, Uygur, Hui, Yi, Tibetan, Miao, Manchu, Mongol, Buyi, Korean, and other nationalities 8.1%

