Domestic Financial Markets 4. Money Markets and Bond Yields
advertisement
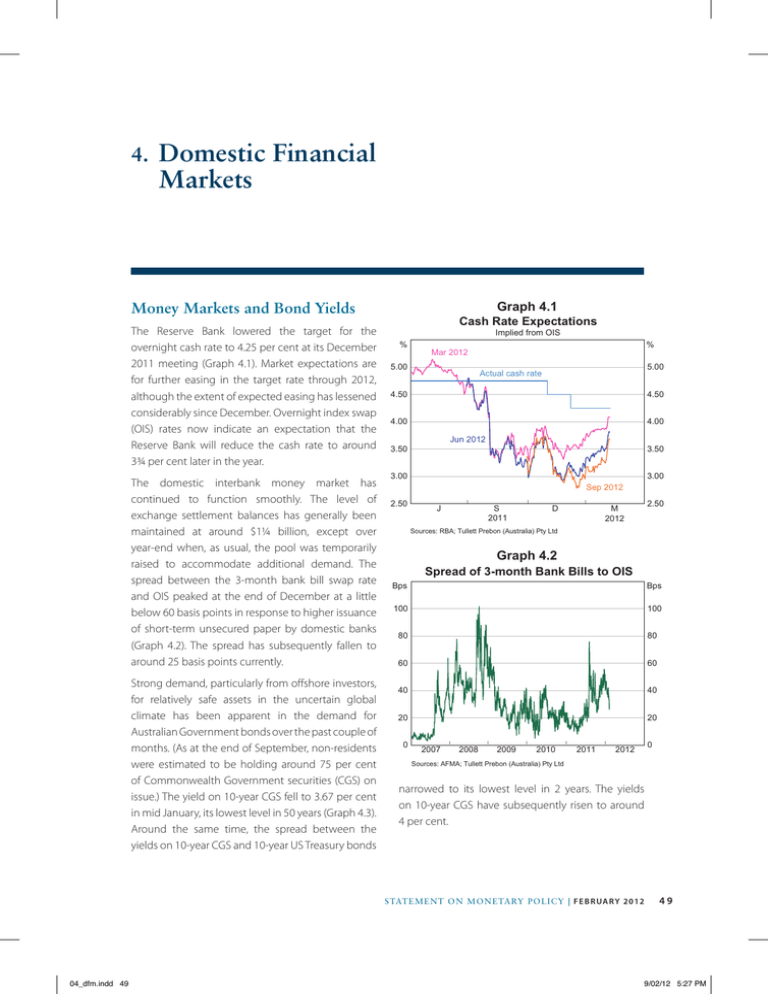
4. Domestic Markets Financial Graph 4.1 Money Markets and Bond Yields The Reserve Bank lowered the target for the overnight cash rate to 4.25 per cent at its December 2011 meeting (Graph 4.1). Market expectations are for further easing in the target rate through 2012, although the extent of expected easing has lessened considerably since December. Overnight index swap (OIS) rates now indicate an expectation that the Reserve Bank will reduce the cash rate to around 33/4 per cent later in the year. The domestic interbank money market has continued to function smoothly. The level of exchange settlement balances has generally been maintained at around $1¼ billion, except over year-end when, as usual, the pool was temporarily raised to accommodate additional demand. The spread between the 3-month bank bill swap rate and OIS peaked at the end of December at a little below 60 basis points in response to higher issuance of short-term unsecured paper by domestic banks (Graph 4.2). The spread has subsequently fallen to around 25 basis points currently. Strong demand, particularly from offshore investors, for relatively safe assets in the uncertain global climate has been apparent in the demand for Australian Government bonds over the past couple of months. (As at the end of September, non-residents were estimated to be holding around 75 per cent of Commonwealth Government securities (CGS) on issue.) The yield on 10-year CGS fell to 3.67 per cent in mid January, its lowest level in 50 years (Graph 4.3). Around the same time, the spread between the yields on 10-year CGS and 10-year US Treasury bonds Cash Rate Expectations Implied from OIS % % Mar 2012 5.00 5.00 Actual cash rate 4.50 4.50 4.00 4.00 Jun 2012 3.50 3.50 3.00 3.00 Sep 2012 2.50 l J l S 2011 l D Sources: RBA; Tullett Prebon (Australia) Pty Ltd Graph 4.2 Spread of 3-month Bank Bills to OIS Bps Bps 100 100 80 80 60 60 40 40 20 20 0 2007 l 2008 l 2009 l 2010 l 2011 l 0 2012 Sources: AFMA; Tullett Prebon (Australia) Pty Ltd narrowed to its lowest level in 2 years. The yields on 10-year CGS have subsequently risen to around 4 per cent. STATE ME N T O N MO N E TARY P O L ICY | F e b r ua r y 2 0 1 2 04_dfm.indd 49 2.50 M 2012 49 9/02/12 5:27 PM Graph 4.3 Graph 4.4 Australian Government Bond Yield State Government and Supranational Debt 10-year 5-year % % % 15 15 6.5 12 12 9 9 6 6 Yield Bps Spread to CGS 300 European Investment Bank 6.0 250 5.5 200 Queensland 5.0 150 South Australia 4.5 3 3 100 4.0 50 Victoria l l l l l l l l l l l l l l l l l l l l l l l l l l l l l l l l l l l l l l l l l l l l l l l l l l l l l l l l l l l l l l 0 1952 1967 1982 1997 0 2012 3.5 Source: RBA 50 l 2010 l l 2011 2012 2010 l 2011 2012 0 Sources: RBA; Yieldbroker The strong investor preference for CGS and a deterioration in liquidity in the state government securities market, primarily as a result of heightened risk aversion related to events in Europe, led to a widening of the spread between yields on these securities (Graph 4.4). At their peak, 5-year spreads had widened by around 70 basis points from where they were at the end of October for South Australia and Queensland, and by around 50 basis points for New South Wales and Victoria. In recent weeks, spreads have narrowed and issuance has picked up considerably. Yields on longer-term state government debt have increased since the previous Statement as the increase in spreads has more than offset the fall in yields on CGS, but they remain low by historical standards. spreads. In the event, not all European names were downgraded. EIB retained its AAA rating but remains on review for a possible downgrade. A small number of Kangaroo bonds became ineligible for sale to the Reserve Bank under repurchase agreement following S&P’s downgrade of some sovereigns. Trading conditions have improved a little since mid January, with five primary issues including two from A rated Korean institutions placing their inaugural Kangaroo bonds. Spreads between yields on Australian dollardenominated securities issued by foreign institutions (Kangaroo bonds) and CGS increased sharply after a number of European sovereigns and agencies were placed on negative ratings watch, and liquidity in the market deteriorated markedly. Five-year spreads on securities issued by the AAA rated European Investment Bank (EIB), the largest Kangaroo issuer, widened by as much as 180 basis points from their level three months ago. The widening in spreads on European sovereign agency issuers, such as those from Norway, Sweden and Germany, was smaller. Non-European supranational issuers, such as the World Bank, also experienced some widening in Funding Composition of Banks in Australia* Financial Intermediaries The composition of bank funding has continued to shift towards deposit liabilities, reflecting solid Graph 4.5 Per cent of funding % % 50 50 Domestic deposits 40 40 Short-term debt** 30 30 20 20 Long-term debt 10 0 Equity 10 Securitisation 2004 2006 2008 2010 * Adjusted for movements in foreign exchange rates ** Includes deposits and intragroup funding from non-residents Sources: APRA; RBA; Standard & Poor’s 2012 0 R es erv e B a n k o f Aus t r a l i a 04_dfm.indd 50 9/02/12 5:27 PM Graph 4.6 growth in household term deposits. The deposit share of bank funding is now at its highest level since 1998, at just under 52 per cent (Graph 4.5). Bank funding costs have increased relative to the cash rate over the past six months. In particular, there have been increases in the spreads on term deposits due to competition for deposit funding, an increase in the spreads on wholesale funding due to an increase in the compensation required by investors globally for bank credit risk (see chapter on ‘International and Foreign Exchange Markets’) and an increase in the cost of foreign exchange hedging. These developments are summarised below and a more detailed discussion of developments in bank funding costs will be provided in the March Reserve Bank Bulletin. Banks have continued to compete actively for deposits in recent months. The average rate on major banks’ term deposit ‘specials’ has fallen by less than the cash rate, and the spread paid on term deposits has generally been above spreads on equivalent wholesale funding instruments (Graph 4.6). The average interest rate on the major banks’ at-call deposits (including online savings, bonus saver and cash management accounts) has fallen by around 50 basis points over the past quarter, in line with movements in the cash rate. Yields on the major banks’ senior unsecured bonds have increased a little since the previous Statement, but are around 80 basis points below their average for the first half of 2011 (Graph 4.7). Spreads on the major banks’ unsecured bonds widened sharply around year end, reflecting the broad-based increase in the compensation required by investors globally for bank credit risk. More recently, however, banks have begun to issue unsecured bonds for terms of up to 5 years at somewhat narrower spreads. The cost of offshore debt issuance has also increased because there has been a significant increase in the cost of hedging (Graph 4.8). This increased cost reflects both a pick-up in offshore issuance by Australian banks and weak Kangaroo bond issuance, which has typically been one of the predominant Major Banks’ Pricing of Term Deposits and Bonds A$ debt Bps 200 6-month spreads to OIS 3-year spreads to CGS Term deposit specials Bps 200 100 100 Bank bonds 0 0 Bank bills -100 2008 2010 2008 2012 2010 2012 -100 Sources: Bloomberg; RBA; Thomson Reuters; UBS AG, Australia Branch Graph 4.7 Major Banks’ Bond Pricing 3-year A$ debt % Yields Bps Spread to Senior bank bonds CGS rated AA* 8 180 Swap 5 90 Swap CGS 2 2008 2010 2012 2008 2010 2012 0 * S&P downgraded the major Australian banks to AA- in December 2011 Sources: Bloomberg; RBA; UBS AG, Australia Branch Graph 4.8 Cross-currency Basis Swap Spreads 5-year Bps Bps Yen 100 100 75 75 Euro 50 50 25 25 US$ 0 0 -25 -25 l -50 2007 l 2008 l 2009 l 2010 l 2011 -50 2012 Source: Bloomberg S TATE ME N T O N MO N E TARY P O L ICY | F e b r ua r y 2 0 1 2 51 sources of flows swapping Australian dollars into foreign currency. Australian banks have issued around $28 billion worth of bank bonds since the previous Statement, compared with issuance of $6½ billion in the prior three months (Graph 4.9). Some of the pick-up in issuance can be explained by the major banks’ refinancing relatively large bond maturities in January, two-thirds of which are government guaranteed bonds. During 2011, banks’ outstanding bond funding declined somewhat, partly reflecting the reduced need for this funding given the strength in deposit growth relative to credit growth. The composition of recent Australian bank bond issuance reflects the global trend towards issuing secured bonds as a way of mitigating the perceived increase in bank credit risk. Since the most recent Statement, there has been around $91/2 billion of unsecured issuance by the major banks. In contrast, the major banks have issued $17 billion in AAA rated covered bonds since they were issued for the first time in November 2011. The initial issues were completed by the major banks in the US dollar market at spreads of around 230 basis points to CGS, reflecting both the broad-based increase in spreads on bank debt and the higher costs of exchange rate hedging. In January, there were two large domestic covered bonds issued with spreads of around 250 basis points over CGS; these spreads have subsequently narrowed by around 30 basis points. Covered bonds have allowed the banks to achieve good issuance volumes and at longer tenors than is normally the case with unsecured debt, particularly in the current environment (see ‘Box D: Covered Bond Issuance by Australian Banks’ for more details). Since the November Statement, there have been four residential mortgage-backed securities (RMBS) transactions totalling $2.4 billion (Graph 4.10). The main AAA tranches of these deals were at the 3-year tenor. Private investors took up most of the issuance, with the Australian Office of Financial Management (AOFM) only purchasing around one-quarter. Issuance spreads have continued to rise, consistent with developments in other bank debt markets. There has been no RMBS issuance so far in 2012. In December, S&P downgraded the credit ratings of the four major Australian banks by one notch from AA to AA-, following the global application of its revised ratings methodology for banking industries. The revision brought S&P’s credit ratings for most of the major Australian banks to one notch below those of Moody’s and Fitch. There was little market reaction to S&P’s announcement. The major Australian banks now form four of only 20 global banks rated within the AA band or higher. As part of the same exercise, the Bank of Queensland’s rating was lowered by Graph 4.10 Graph 4.9 Australian RMBS Issuance* Banks’ Bond Issuance A$ equivalent $b Offshore* Onshore* Maturities 60 $b 60 Net issuance 30 24 A$ equivalent $b Purchases by the AOFM Offshore Onshore 24 30 0 16 16 8 8 0 -30 -30 -60 2007 2008 2009 * Latest quarter issuance to date Source: RBA 52 $b 2010 2011 2012 -60 0 2000 2003 2006 2009 2012 0 * Latest quarter issuance to date Source: RBA R es erv e B a n k o f Aus t r a l i a 04_dfm.indd 52 9/02/12 5:27 PM one notch from BBB+ to BBB, Macquarie Bank retained its A rating (although Macquarie Group was downgraded by two notches from A- to BBB), Suncorp-Metway’s A+ rating was affirmed, while Bendigo and Adelaide Bank’s rating was raised by one notch to A-. More recently, Fitch has announced that it has placed the Australian major banks on negative ratings watch. Household Financing average, about 25 basis points lower than variable rates, and the share of housing loans approved at fixed rates has increased to be just above its long-run average. Overall, the average rate on outstanding housing loans (fixed and variable) has fallen by 44 basis points since the end of October, to be 17 basis points below its post-1996 average (Graph 4.11). Graph 4.11 Average Interest Rates on Outstanding Lending % Most bank and non-bank lenders lowered their variable housing loan indicator rates in line with the reductions in the cash rate at the November and December Board meetings (Table 4.1). Taking into account the cessation of some additional discount offers introduced in mid 2011, average interest rates on new full-doc, variable-rate housing loans have decreased by slightly less than the cash rate since the end of October. Rates on new fixed-rate mortgages have also fallen since the end of October. Fixed rates are now, on % Housing 8 8 6 6 Average 4 4 % % Cash rate 8 8 6 6 4 4 2 2000 2004 Sources: ABS; APRA; Perpetual; RBA 2008 2012 2 Table 4.1: Intermediaries’ Variable Lending Rates Per cent Change since: Level at end January 2012 End October 2011 End November 2010 Housing loans(a) 6.59 –0.44 –0.56 Personal loans 12.97 –0.24 0.17 Small business Residentially secured – Term loans 8.52 –0.48 –0.48 – Overdraft 9.38 –0.48 –0.48 Average rate(b) 8.25 –0.48 –0.56 6.70 –0.26 –0.21 Large business Average actual rate(b) (variable-rate and bill funding) (a)Average of the major banks’ discounted package rates on $250 000 full-doc loans (b)Rates on outstanding, as opposed to new, business lending Sources: ABS; APRA; RBA STATE ME N T O N MO N E TARY P O L ICY | F e b r ua r y 2 0 1 2 04_dfm.indd 53 53 9/02/12 5:27 PM The total value of housing loan approvals was broadly unchanged over the three months to November; a fall in approvals to investors and repeat buyers offset a rise in approvals to first home buyers (Graph 4.12). The expiry of some first home buyer stamp duty exemptions in New South Wales at the end of 2011 is likely to have brought forward some housing loan approvals that would have otherwise occurred in 2012. Growth in housing credit has remained around an annual pace of 5–6 per cent and, given the level of loan approvals, is likely to remain around that pace in the period ahead (Graph 4.13). Graph 4.12 Value of Housing Loan Approvals Net of refinancing $b $b Non-FHB owner-occupiers 9 20 Total 6 16 Investors 3 12 First home buyers 0 2004 2008 2012 2004 2008 8 2012 Sources: ABS; RBA Graph 4.13 Credit Growth Year-ended % % 30 30 Housing 20 20 10 10 0 0 Total* -10 1982 1998 1994 2000 * Includes housing, personal and business credit Source: RBA 54 Business 2006 -10 2012 Personal credit continued to contract in the December quarter. The fall was largely the result of a decline in margin lending. The high frequency of margin calls, due to volatility in global equity markets, and heightened investor risk aversion are likely to have weighed on margin lending activity. Business Financing Corporate bond spreads have continued to widen over recent months. For example, average secondary market yields on BBB rated corporate bonds have risen by around 30 basis points relative to CGS yields since the previous Statement, with the level of yields rising by around 15 basis points over this period (Graph 4.14). Notwithstanding this increase in spreads, funding conditions in wholesale markets for some corporates have been more favourable than for financial institutions, despite having a lower credit rating. For example, Coca-Cola Amatil (rated A-) raised 5-year bond funding at a spread that was 120 basis points tighter to the bank bill swap rate than Westpac’s 5-year AAA rated covered bond. Corporate bond issuance has been relatively strong over the past few months; deals worth around $7 billion have been completed (Graph 4.15). The bulk of this issuance was in November in offshore markets, and many were done at tenors of around 10 years or longer, which is difficult to achieve in the domestic market. Intermediated business credit grew at a monthly average rate of around 0.2 per cent in the December quarter. Most of this growth was accounted for by an increase in lending to private trading corporations, rather than to small businesses. Business lending extended by euro area bank branches and subsidiaries fell over the quarter, following more modest declines since the beginning of 2009. Lending by European entities is currently less than 4 per cent of business credit. The value of syndicated loan approvals, around two-thirds of which are included in domestic business credit, increased over the December R es erv e B a n k o f Aus t r a l i a 04_dfm.indd 54 9/02/12 5:27 PM Graph 4.14 Australian Corporates’ Bond Pricing 3-year A$ debt % 8 Yields Bps Spread to CGS BBB corporates 480 6 320 CGS 4 2 2002 160 2007 2012 2002 2007 0 2012 Sources: RBA; UBS AG, Australia Branch Graph 4.15 Indicator rates on new variable-rate small business loans have fallen by 48 basis points, while indicator rates on new fixed-rate loans have declined by 21 basis points. As such, the average rates on banks’ outstanding lending to small and large businesses have fallen to be around their post-1996 averages (Graph 4.16). Net business external funding picked up in the December quarter. This was largely due to an increase in non-intermediated debt; equity raisings and business credit growth were more modest. Net equity issuance in 2011 was at its lowest level in nearly a decade, reflecting the already low level of corporate gearing. There were also some large buybacks, particularly by resource companies. Australian Corporates’ Bond Issuance $b 8 Graph 4.16 $b Offshore* Onshore* Maturities 8 4 4 0 0 -4 -4 % Average Interest Rates on Outstanding Business Lending 10 10 8 6 8 Average % -8 2002 2004 2006 2008 2010 2012 -8 * Latest quarter issuance to date Source: RBA The cost of new intermediated business borrowing has declined over the past three months, commensurate with the fall in benchmark rates. 6 % Large business 8 8 6 6 4 4 2 quarter, although the rise was driven by a pick-up in refinancing approvals. As with business credit more generally, the outstanding value of syndicated lending extended by euro area banks has declined over the second half of 2011, and has been offset by an increase in the role played by Asia-based institutions. Euro area banks accounted for a little over 10 per cent of Australian syndicated loan approvals in 2011, compared with an average of 20 per cent over the two preceding years. % Small business 2000 Sources: APRA; RBA 2004 2008 2012 Aggregate Credit Total outstanding credit grew at an annualised rate of 3.5 per cent over the December quarter, with modest growth in household credit and little growth in business credit (Table 4.2). Growth in broad money continues to outpace credit growth, reflecting a preference by households and businesses to hold their assets in deposits, particularly given the uncertainty surrounding equity markets. STATE ME N T O N MO N E TARY P O L ICY | F e b r ua r y 2 0 1 2 04_dfm.indd 55 2 55 9/02/12 5:27 PM Table 4.2: Financial Aggregates Percentage change Average monthly growth September quarter 2011 December quarter 2011 Year to December 2011 Total credit 0.4 0.3 3.5 – Owner-occupier housing 0.5 0.4 5.7 – Investor housing 0.4 0.3 4.8 – Personal –0.4 –0.1 –1.0 – Business 0.3 0.2 1.3 Broad money 0.9 0.5 7.4 Source: RBA Graph 4.17 Equity Markets Conditions have been more settled in equity markets in the past couple of months, with volatility returning to average levels, following relatively high volatility at times during the second half of 2011. International developments, particularly regarding European sovereign debt, continue to be a focus of the market. The ASX 200 has increased by 3 per cent since the previous Statement, underperforming global equity markets (Graph 4.17). Consumer discretionary stocks have underperformed the ASX 200, weighed down by a large fall in some retailers stocks following some downward revisions to profit forecasts. Share prices of Australian financials underperformed slightly, with the insurance sector showing a fall of 4 per cent; QBE announced that earnings would be 50 per cent lower than in 2010 due to record catastrophe claims and weak investment returns. Bank share prices have moved broadly in line with the overall market over the past year and have outperformed bank share price indices in Europe, the United Kingdom and the United States (Graph 4.18). Merger and acquisition activity has been modest, with $13 billion in deals announced since the previous Statement, mostly in December. The larger deals that have been announced involve companies in the resource sector. Around $20 billion in deals are still pending. 56 Australian Share Prices End December 2010 = 100 Index Index Financials 100 100 90 90 Consumer discretionary ASX 200 80 80 Resources l 70 l l J M S l D 70 M 2012 2011 Source: Bloomberg Graph 4.18 Commercial Banks’ Share Prices End December 2007 = 100 Index Canada 100 Index 100 Australia 75 75 UK 50 50 Europe 25 25 US 0 l 2008 l 2009 l 2010 0 l 2011 2012 Sources: Bloomberg; RBA R es erv e B a n k o f Aus t r a l i a 04_dfm.indd 56 9/02/12 5:27 PM
