Box A: Measuring Global Growth
advertisement

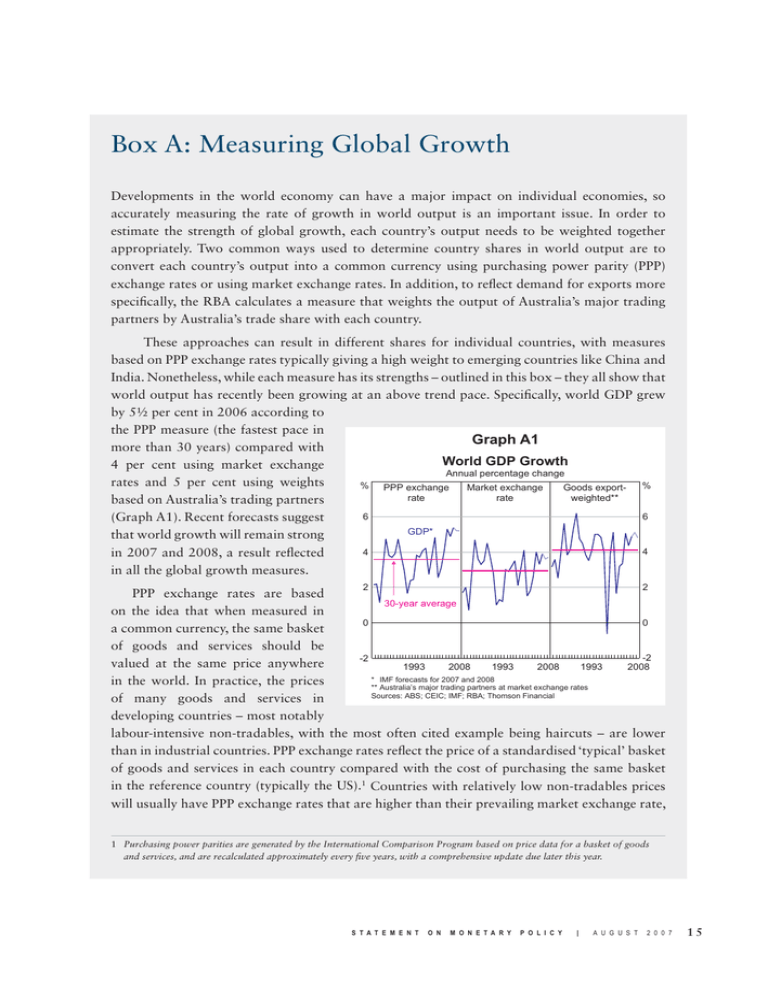
Box A: Measuring Global Growth Developments in the world economy can have a major impact on individual economies, so accurately measuring the rate of growth in world output is an important issue. In order to estimate the strength of global growth, each country’s output needs to be weighted together appropriately. Two common ways used to determine country shares in world output are to convert each country’s output into a common currency using purchasing power parity (PPP) exchange rates or using market exchange rates. In addition, to reflect demand for exports more specifically, the RBA calculates a measure that weights the output of Australia’s major trading partners by Australia’s trade share with each country. These approaches can result in different shares for individual countries, with measures based on PPP exchange rates typically giving a high weight to emerging countries like China and India. Nonetheless, while each measure has its strengths – outlined in this box – they all show that world output has recently been growing at an above trend pace. Specifically, world GDP grew by 5½ per cent in 2006 according to the PPP measure (the fastest pace in Graph A1 more than 30 years) compared with World GDP Growth 4 per cent using market exchange rates and 5 per cent using weights based on Australia’s trading partners (Graph A1). Recent forecasts suggest that world growth will remain strong in 2007 and 2008, a result reflected in all the global growth measures. Annual percentage change % PPP exchange rate Market exchange rate Goods exportweighted** % 6 6 GDP* 4 4 2 2 PPP exchange rates are based 30-year average on the idea that when measured in 0 0 a common currency, the same basket of goods and services should be -2 -2 valued at the same price anywhere 1993 2008 1993 2008 1993 2008 * IMF forecasts for 2007 and 2008 in the world. In practice, the prices ** Australia’s major trading partners at market exchange rates Sources: ABS; CEIC; IMF; RBA; Thomson Financial of many goods and services in developing countries – most notably labour-intensive non-tradables, with the most often cited example being haircuts – are lower than in industrial countries. PPP exchange rates reflect the price of a standardised ‘typical’ basket of goods and services in each country compared with the cost of purchasing the same basket in the reference country (typically the US).1 Countries with relatively low non-tradables prices will usually have PPP exchange rates that are higher than their prevailing market exchange rate, 1 Purchasing power parities are generated by the International Comparison Program based on price data for a basket of goods and services, and are recalculated approximately every five years, with a comprehensive update due later this year. S T A T E M E N T O N M O N E T A R Y P O L I C Y | A U G U S T 2 0 0 7 15 and hence the value of their output – and their share in world GDP – will be larger when it is converted using PPP exchange rates. During the past decade, annual growth in world output measured on a PPP basis has averaged around 4 per cent, while growth based on prevailing market exchange rates has averaged 3 per cent. China and India account for virtually all of this divergence due to their higher shares in world output when measured on a PPP basis and their rapid rates of growth. Specifically, China currently accounts for 15 per cent of the global economy on a PPP basis (the second largest behind the United States), whereas on a market exchange rate basis its share is only 5 per cent (the fourth largest economy; Graph A2). Similarly, India accounts for 6 per cent of the world economy using PPP exchange rates (the same size as Japan) but only 2 per cent based on market exchange rates (only slightly bigger than Australia). Together, over the past decade China and India have contributed an average of 1½ percentage points each year to Graph A2 world growth when measured in PPP terms, compared with ½ percentage Share of World GDP % % China India point in market exchange rate terms. Another way to measure the strength of the world economy is PPP exchange to weight the output of Australia’s rate major trading partners (using market 8 8 exchange rates) by the share of our Market exchange rate exports going to each country. In 4 4 recent years, the estimate of world growth using Australia’s exportweighted trading partner growth 0 0 1986 1996 2006 1986 1996 2006 has been quite similar to the PPPSource: IMF weighted measures. This reflects the fact that both the PPP exchange rate and the export-weighted approaches give a comparatively high weight to output in east Asia, and a low weight to the US and Europe (Table A1). However, the very high weight of the ‘other east Asia’ group in the export-weighted measure means that trading partner growth fluctuated sharply at the time of the Asian crisis. 12 12 Each of these methods of estimating world output has its strengths, depending on the issue being considered. Estimating world output using PPP exchange rates is generally regarded as a better measure of changes in world economic well-being since it is based on a uniform price for goods and services regardless of where they are produced and since it is less affected by shortterm exchange rate volatility. However, growth measures based on market exchange rates – either to aggregate world output or to weight by Australia’s trade shares – can be more relevant when focusing on the implications of global growth for world or Australian transactions that occur at market exchange rates, such as trade and other financial flows. R 16 R E S E R V E B A N K O F A U S T R A L I A Table A1: Share of World Activity Selected economies, 2006, per cent GDP United States Euro area Japan China Other east Asia India Australia (a) Australia’s exports(a) PPP exchange rates Market exchange rates 20 15 6 15 7 6 1 28 23 9 5 5 2 2 6 7 19 14 24 6 na Merchandise exports, valued at market exchange rates Sources: ABS; IMF; RBA S T A T E M E N T O N M O N E T A R Y P O L I C Y | A U G U S T 2 0 0 7 17


