Box A: US Corporate Profits
advertisement

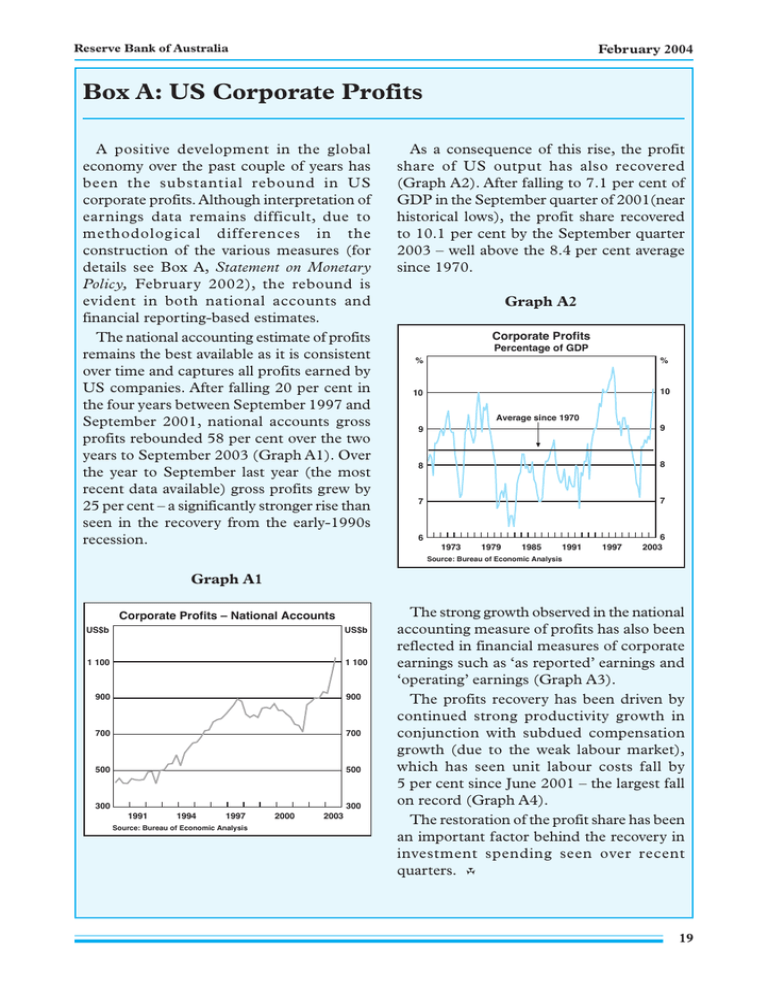
Reserve Bank of Australia February 2004 Box A: US Corporate Profits A positive development in the global economy over the past couple of years has been the substantial rebound in US corporate profits. Although interpretation of earnings data remains difficult, due to methodolog ical differences in the construction of the various measures (for details see Box A, Statement on Monetary Policy, February 2002), the rebound is evident in both national accounts and financial reporting-based estimates. The national accounting estimate of profits remains the best available as it is consistent over time and captures all profits earned by US companies. After falling 20 per cent in the four years between September 1997 and September 2001, national accounts gross profits rebounded 58 per cent over the two years to September 2003 (Graph A1). Over the year to September last year (the most recent data available) gross profits grew by 25 per cent – a significantly stronger rise than seen in the recovery from the early-1990s recession. As a consequence of this rise, the profit share of US output has also recovered (Graph A2). After falling to 7.1 per cent of GDP in the September quarter of 2001(near historical lows), the profit share recovered to 10.1 per cent by the September quarter 2003 – well above the 8.4 per cent average since 1970. Graph A2 Corporate Profits Percentage of GDP % % 10 10 Average since 1970 9 9 8 8 7 7 6 1973 1979 1985 1991 1997 6 2003 Source: Bureau of Economic Analysis Graph A1 Corporate Profits – National Accounts US$b US$b 1 100 1 100 900 900 700 700 500 500 300 300 1991 1994 1997 Source: Bureau of Economic Analysis 2000 2003 The strong growth observed in the national accounting measure of profits has also been reflected in financial measures of corporate earnings such as ‘as reported’ earnings and ‘operating’ earnings (Graph A3). The profits recovery has been driven by continued strong productivity growth in conjunction with subdued compensation growth (due to the weak labour market), which has seen unit labour costs fall by 5 per cent since June 2001 – the largest fall on record (Graph A4). The restoration of the profit share has been an important factor behind the recovery in investment spending seen over recent quarters. R 19 February 2004 Statement on Monetary Policy Graph A3 Graph A4 US Corporate Earnings Nominal Unit Labour Costs 1995 = 100 Four-quarter-ended percentage change Index Index 200 % % 10 10 200 ‘Operating’ earnings 150 150 100 100 5 5 0 0 ‘As reported’ earnings 50 50 0 0 1995 1997 Source: Standard and Poor’s 20 1999 2001 2003 -5 1953 1963 1973 Source: Bureau of Labor Statistics 1983 1993 -5 2003


