BLUE MUSSELS AND PACIFIC OYSTERS IN BELGIAN COASTAL HARBOURS

BLUE MUSSELS AND PACIFIC OYSTERS
IN BELGIAN COASTAL HARBOURS
AS TEST ORGANISMS FOR ENVIRONMENTAL STRESS
Karen Rappé
1
& Magda Vincx
1
Introduction
Harbours receive, as semi-enclosed structures, high loads of chemical substances through river inputs and direct discharges (oil spills) as well as by indirect ways such as shipping traffic, atmospheric deposition, wastewater, etc. This means that organisms living in harbours are exposed to a wide range of pollutants which have the potential to cause stress by disturbing the normal functioning of the biological organisation.
As part of the INRAM project, in which the risk of micropollutants is studied for the Belgian coastal zone, a cage experiment with mussels and oysters was conducted in three coastal harbours to study the susceptibility of these bivalves to the prevealing stress.
Methodology
ZB_1
Eastern Scheldt
ZB_2
OO
Nippon
Crassostrea gigas
Mytilus edulis
In situ
field assay with
Mytilus edulis & Crassostrea gigas
:
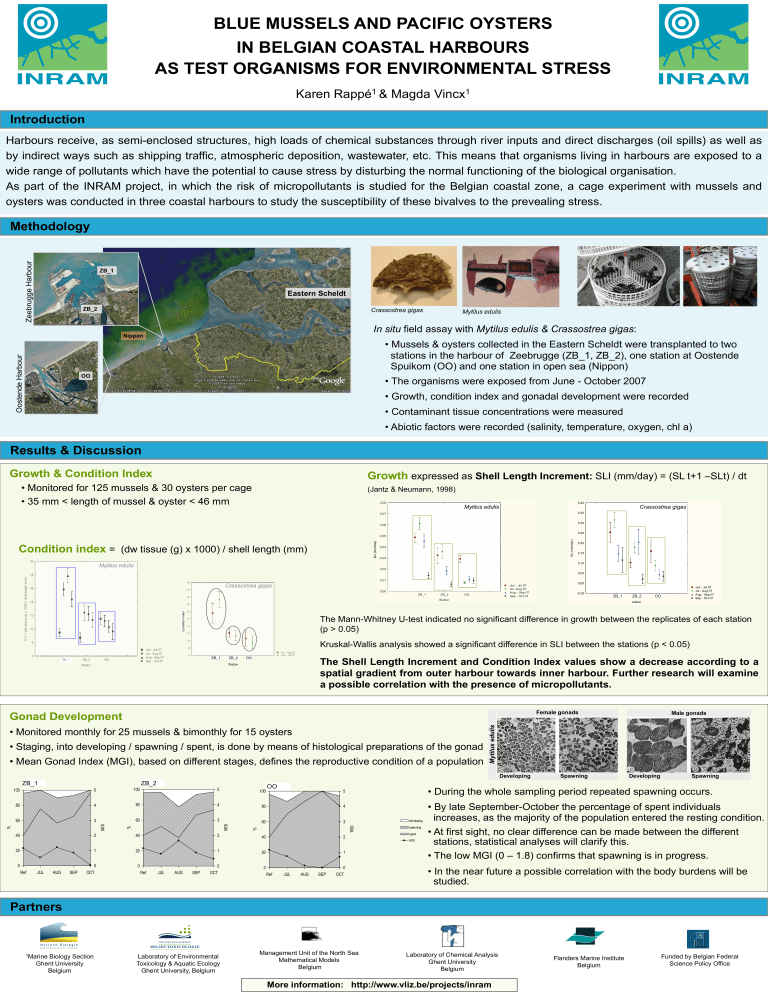
• Mussels & oysters collected in the Eastern Scheldt were transplanted to two stations in the harbour of Zeebrugge (ZB_1, ZB_2), one station at Oostende
Spuikom (OO) and one station in open sea (Nippon)
• The organisms were exposed from June - October 2007
• Growth, condition index and gonadal development were recorded
• Contaminant tissue concentrations were measured
• Abiotic factors were recorded (salinity, temperature, oxygen, chl a)
Results & Discussion
Growth & Condition Index
• Monitored for 125 mussels & 30 oysters per cage
• 35 mm < length of mussel & oyster < 46 mm
Condition index
= (dw tissue (g) x 1000) / shell length (mm)
20
Mytilus edulis
18
16
14
12
10
8
6
ZB_1 ZB_2
Station
OO
Jun - Jul 07
Jul - Aug 07
Aug - Sep 07
Sep - Oct 07
12
10
8
6
16
14
26
24
22
20
18
Crassostrea gigas
Jun - Aug 07
Aug - Oct 07
Station
0,04
0,03
0,02
0,01
0,00
0,08
0,07
0,06
0,05
Growth
expressed as Shell Length Increment: SLI (mm/day) = (SL t+1 –SLt) / dt
(Jantz & Neumann, 1998)
ZB_1 ZB_2
Station
Mytilus edulis
OO
Jun - Jul 07
Jul -Aug 07
Aug - Sep 07
Sep - Oct 07
0,40
0,35
0,30
0,25
0,20
0,15
0,10
0,05
0,00
-0,05
Crassostrea gigas
Jun - Jul 07
Jul - Aug 07
Aug - Sep 07
Sep - Oct 07 station
The Mann-Whitney U-test indicated no significant difference in growth between the replicates of each station
(p > 0.05)
Kruskal-Wallis analysis showed a significant difference in SLI between the stations (p < 0.05)
The Shell Length Increment and Condition Index values show a decrease according to a spatial gradient from outer harbour towards inner harbour. Further research will examine a possible correlation with the presence of micropollutants.
0
Ref JUL AUG SEP OCT
0 0
Ref OCT
0
0
Ref OCT
0
Female gonads Male gonads
Gonad Development
• Monitored monthly for 25 mussels & bimonthly for 15 oysters
• Staging, into developing / spawning / spent, is done by means of histological preparations of the gonad
• Mean Gonad Index (MGI), based on different stages, defines the reproductive condition of a population
100
80
60
40
20
5
4
3
2
1
100
80
60
40
20
JUL AUG SEP
5
4
3
2
1
100
80
60
40
20
JUL AUG SEP
5
4
3
2
1
Developing Spawning Developing Spawning developing spawning spent
MGI
• During the whole sampling period repeated spawning occurs.
• By late September-October the percentage of spent individuals increases, as the majority of the population entered the resting condition.
• At first sight, no clear difference can be made between the different stations, statistical analyses will clarify this.
• The low MGI (0 – 1.8) confirms that spawning is in progress.
• In the near future a possible correlation with the body burdens will be studied.
Partners
1 Marine Biology Section
Ghent University
Belgium
Laboratory of Environmental
Toxicology & Aquatic Ecology
Ghent University, Belgium
Management Unit of the North Sea
Mathematical Models
Belgium
Laboratory of Chemical Analysis
Ghent University
Belgium
More information: http://www.vliz.be/projects/inram
Flanders Marine Institute
Belgium
Funded by Belgian Federal
Science Policy Office


