The Australian Hedge Fund Industry 1
advertisement
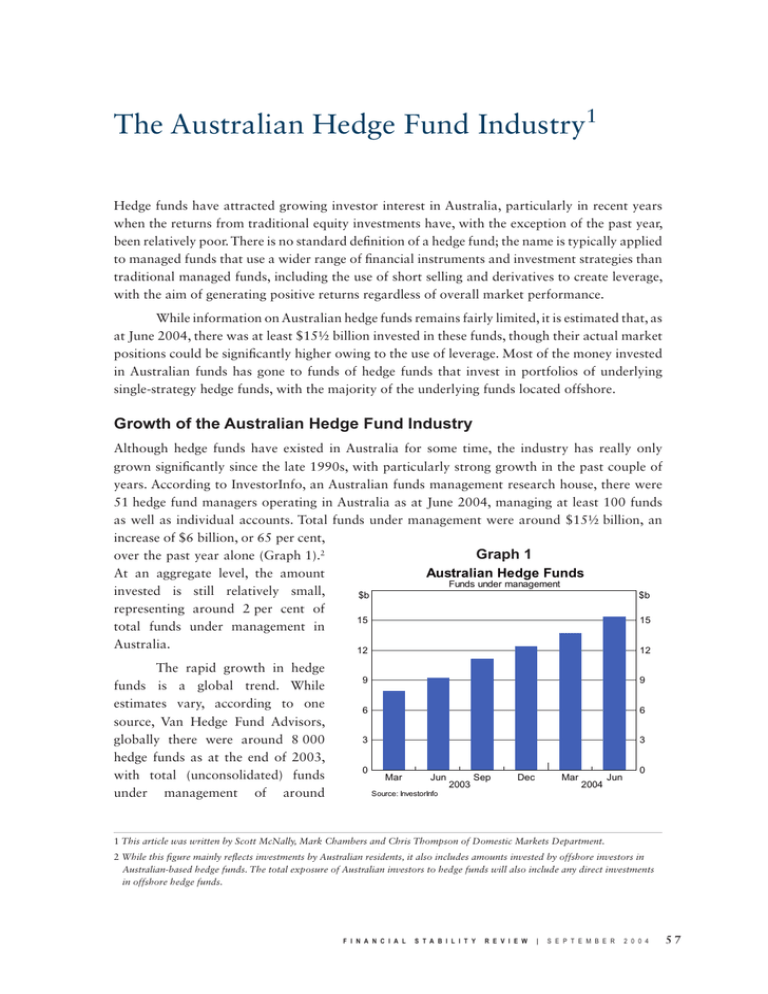
The Australian Hedge Fund Industry1 Hedge funds have attracted growing investor interest in Australia, particularly in recent years when the returns from traditional equity investments have, with the exception of the past year, been relatively poor. There is no standard definition of a hedge fund; the name is typically applied to managed funds that use a wider range of financial instruments and investment strategies than traditional managed funds, including the use of short selling and derivatives to create leverage, with the aim of generating positive returns regardless of overall market performance. While information on Australian hedge funds remains fairly limited, it is estimated that, as at June 2004, there was at least $15½ billion invested in these funds, though their actual market positions could be significantly higher owing to the use of leverage. Most of the money invested in Australian funds has gone to funds of hedge funds that invest in portfolios of underlying single-strategy hedge funds, with the majority of the underlying funds located offshore. Growth of the Australian Hedge Fund Industry Although hedge funds have existed in Australia for some time, the industry has really only grown significantly since the late 1990s, with particularly strong growth in the past couple of years. According to InvestorInfo, an Australian funds management research house, there were 51 hedge fund managers operating in Australia as at June 2004, managing at least 100 funds as well as individual accounts. Total funds under management were around $15½ billion, an increase of $6 billion, or 65 per cent, Graph 1 over the past year alone (Graph 1).2 Australian Hedge Funds At an aggregate level, the amount Funds under management invested is still relatively small, $b $b representing around 2 per cent of 15 15 total funds under management in Australia. 12 12 The rapid growth in hedge funds is a global trend. While estimates vary, according to one source, Van Hedge Fund Advisors, globally there were around 8 000 hedge funds as at the end of 2003, with total (unconsolidated) funds under management of around 9 9 6 6 3 3 0 Mar Jun 2003 Sep Dec Mar 2004 Jun 0 Source: InvestorInfo 1 This article was written by Scott McNally, Mark Chambers and Chris Thompson of Domestic Markets Department. 2 While this figure mainly reflects investments by Australian residents, it also includes amounts invested by offshore investors in Australian-based hedge funds. The total exposure of Australian investors to hedge funds will also include any direct investments in offshore hedge funds. F I N A N C I A L S T A B I L I T Y R E V I E W | S E P T E M B E R 2 0 0 4 57 Graph 2 Global Hedge Funds US$b No Funds under management 1000 800 (LHS) 10000 8000 Number of funds (RHS) 600 6000 400 4000 200 2000 0 1999 2000 2001 2002 2003 * 2004 figures are estimates by Van Hedge Fund Advisors. Source: Van Hedge Fund Advisors 2004* 0 US$800 billion. This is up from around 6 000 hedge funds and US$500 billion in funds under management in 1999 (Graph 2). Based on these estimates, Australian hedge funds represent around 1 per cent of the global hedge fund industry. As in Australia, growth in the global hedge fund industry has been particularly strong in the past couple of years, with total funds under management increasing by 26 per cent in 2003, and more recent estimates pointing to similarly strong growth in 2004. The Structure and Regulation of Hedge Funds in Australia Australian hedge funds are most commonly structured as trusts, although company structures (typically unlisted and domiciled in offshore tax havens) are also used. The administration and investment decisions of the fund are handled by a hedge fund manager, who is appointed by the fund trustees or board of directors. The two main categories of hedge funds are single-manager funds and funds of hedge funds (FOHFs). Single-manager funds undertake direct investments in financial markets, using one or more investment strategies. They usually appoint a prime broker to execute their trades and provide securities lending and other borrowing facilities, as well as to perform back-office functions (such as settlement and custodial services); the prime brokers appointed by Australian hedge funds are mainly global investment banks. Unlike single-manager funds, FOHFs do not take positions in financial markets directly, but instead place investors’ funds in portfolios of single-manager hedge funds, which are usually diversified across hedge fund managers and/or investment styles in an attempt to reduce risk. The main functions of the FOHF manager are the analysis and selection of single-manager hedge funds for inclusion in the FOHF portfolio, and the monitoring of these hedge funds’ performance. Management fees charged by hedge fund managers are usually between 1 and 2 per cent per annum of the fund’s net assets. In addition, most fund managers also receive a performance fee, which is often between 10 and 20 per cent of the positive returns, or of the returns above a hurdle rate such as the bank bill rate. A ‘high watermark’ is also usually employed for the calculation of the performance fee, whereby a fee cannot be charged by the manager until any past under-performance has been recouped. In the case of FOHFs, management and performance fees are charged by the FOHF manager in addition to those charged by the underlying single-manager funds. There are no specific regulations covering hedge funds in Australia. Like other types of managed funds, hedge funds fall under the scope of the Corporations Act 2001; the provisions 58 R E S E R V E B A N K O F A U S T R A L I A that apply depend on whether they are structured as trusts or companies. In the case of a trust, if a hedge fund is marketed to retail investors then it must be registered with ASIC, and is subject to certain operational and disclosure requirements designed to protect investors’ interests. These requirements include the appointment of a responsible entity charged with certain fiduciary duties, the provision of adequate product disclosure statements and annual or semi-annual reporting of financial statements. Hedge funds which do not accept funds from retail investors are subject to fewer requirements, as their investors are considered to be better placed to monitor and manage their investments without government regulation. Hedge funds structured as companies must comply with provisions covering capital raisings, corporate governance and disclosure requirements. Composition of the Australian Hedge Fund Industry As noted above, the Australian hedge fund industry is dominated by FOHFs. Of the hedge funds that are able to be classified by type, FOHFs account for 63 per cent of the total funds under management (Table 1). Moreover, as most of the underlying single-manager hedge funds selected by Australian FOHFs are based offshore (and mainly managed in the US), these FOHFs act mainly as vehicles for the pooling and channelling of funds to foreign hedge fund managers. However, there has been an increasing number of single-manager funds created in Australia in the last few years. Single-manager funds now comprise around 50 per cent by number, but only 37 per cent of the total funds under management. Most single-manager hedge funds in Australia pursue single investment strategies, the majority of which are long/short equity funds; these account for 20 per cent of the total funds under management.3 Of the funds that are classified by type, the average size is around $115 million, though the median size is much lower ($35 million) since there are quite a large number of relatively small hedge funds (Graph 3). The largest fund in Australia is a FOHF with assets under management of around $2 billion. Table 1: Australian Hedge Funds by Type Funds under management, 30 June 2004 Funds of hedge funds Long/short Market neutral Arbitrage Managed futures Global macro Multi-strategy Event driven Total classified Not classified by fund type Total $m Per cent of total classified 6 595 2 115 518 459 374 341 65 60 10 528 4 865 15 393 62.6 20.1 4.9 4.4 3.6 3.2 0.6 0.6 100.0 Source: InvestorInfo 3 See Box 1 for descriptions of the various hedge fund types. F I N A N C I A L S T A B I L I T Y R E V I E W | S E P T E M B E R 2 0 0 4 59 Graph 3 Distribution of Hedge Funds by Size As at 30 June 2004 % % 15 15 10 10 The Australian hedge fund industry is quite heavily concentrated, though the level of concentration has declined a little in recent years with new entrants. The top five hedge fund managers account for 47 per cent of total funds under management, while the top 10 managers make up 66 per cent of the market. The rapid expansion of the Australian hedge fund industry over recent years also means that many 0 0 funds are still relatively young; it is estimated that less than a third of the Funds under management ($m) Source: InvestorInfo funds currently operating in Australia have a track record of three years or more. Historically, hedge funds have experienced a fairly high attrition rate – global estimates suggest that around 7 to 10 per cent of hedge funds cease operations each year. 5 5 Investment in Australian Hedge Funds Whereas in the past, hedge fund investments were mainly made by wealthy private investors, recently there has been a broadening in the investor base which has underpinned growth in the industry. As has been the case globally, there has been increased demand for hedge funds from institutional investors, particularly superannuation funds. An APRA survey of Australian superannuation funds in 2003 (accounting for 28 per cent of the industry’s assets) found that 15 per cent of funds had made hedge fund investments, for which the average exposure was just over 4 per cent of their portfolios. A small proportion reported that over 10 per cent of their portfolios had been allocated to hedge fund investments. In aggregate, the sampled superannuation funds had invested $1.25 billion in hedge funds when the survey was taken.4 Other data sources suggest that the number and value of superannuation mandates awarded to hedge funds has increased over the past year. The accessibility of hedge funds to retail investors has also increased in recent years. This has been facilitated by: more funds offering low minimum investment requirements (some funds now only require a minimum investment of $2 000); more flexible investment conditions, such as easier redemption and shorter or zero initial lock-up periods; a greater number of hedge funds being rated by fund rating agencies and, associated with this, a growing number of funds appearing on the approved product lists of financial planners; and increased advertising and promotional activity aimed at retail investors, particularly by FOHFs emphasising their potential diversification benefits. The growing number of retail-targeted FOHFs, and the increasing availability of hedge funds through master trusts and wraps, has also allowed retail 4 Some of these superannuation funds may have invested directly in offshore hedge funds rather than in Australian-based funds, in which case they will not show up in the $15½ billion figure quoted earlier on the size of the Australian hedge fund industry. 60 R E S E R V E B A N K O F A U S T R A L I A investors access to hedge funds that would ordinarily require high minimum investments, or which have other restrictions on retail investors. Finally, some FOHF providers have begun enabling investments via margin lending facilities, further increasing the accessibility, but also the riskiness, of these products. There has also been a proliferation of capital-guaranteed FOHF products which are lower risk and tend to appeal more to retail investors. Hedge Fund Leverage Some hedge funds use leverage to increase the size of their market positions in excess of invested capital. Leverage can be obtained by borrowing from institutions, short selling, or from trading in derivatives (such as futures and options). Leverage has the effect of magnifying the risks faced by hedge funds and can result in higher volatility of returns. While there is no comprehensive information available on the degree of leverage used by Australian hedge funds, data on international hedge funds, in which most Australian-based FOHFs invest, provide some indication. According to Van Hedge Fund Advisors, of the hedge funds that they tracked globally as at the end of 2003, roughly 30 per cent reported that they did not use leverage, 40 per cent reported balance-sheet leverage (the sum of total long and short positions on balance sheet divided by total capital) less than 2, and the remainder had leverage greater than 2. Note that these estimates are likely to understate the total exposure of hedge funds as they exclude off-balance-sheet leverage obtained from derivatives. In addition, because some investors have a negative perception of leverage, there may be an incentive for hedge funds to report lower leverage than they actually use (indeed, a large number of funds choose not to report leverage at all). The possibility for leverage to be employed by hedge fund investors (through margin loans, for example) and at the FOHF level can add further layers of risk to what may already be leveraged underlying investments. Performance of Australian Hedge Funds Over the past three years – the longest period for which representative data are available – hedge funds have shown relatively strong performance. On average they outperformed all major benchmarks during this period, though they underperformed relative to Australian and international equities during the year to end June 2004 (Table 2). It should also be noted that the average returns of hedge funds may be biased upwards as the sample can be affected by selection bias as well as survivorship bias.5 Single-manager hedge funds have generally outperformed FOHFs in each of the past three years. The relative underperformance of FOHFs may be partly explained by the higher total management fees of those funds, but might also be due to a large proportion of those funds’ assets being invested in offshore hedge funds, which have tended to underperform Australian-based single-manager funds in the past three years. 5 Selection bias will occur if hedge fund managers choose to report only on their best performing funds, or if hedge fund managers selectively choose the history of returns which they report. Survivorship bias may be a problem if the returns from hedge funds which are terminated or stop reporting are subsequently dropped from the sample, or if hedge funds do not start reporting until after an incubation period in which poor hedge funds fail and only the best performing hedge funds survive. F I N A N C I A L S T A B I L I T Y R E V I E W | S E P T E M B E R 2 0 0 4 61 Table 2: Performance of Australian Hedge Funds and Asset-class Benchmarks Per cent(a) 12 months to: 30 June 2002 30 June 2003 30 June 2004 3 year annualised Australian hedge funds 9.2 – Funds of hedge funds 5.6 – Single-manager hedge funds 12.6 ASX 200 Accumulation Index -4.7 US S&P 500 Total Return Index (US$) -18.0 MSCI World Total Return Index (local currency) -17.8 UBS Australian Composite Bond Index 6.2 UBS Australian Bank Bill Index 4.7 CSFB/Tremont Hedge Fund Index (global) 3.6 11.2 7.8 15.0 -1.7 0.3 12.2 7.9 16.5 21.6 19.1 10.8 6.7 14.6 4.4 -0.7 -5.4 9.8 5.0 9.8 21.1 2.3 5.3 10.1 -2.0 6.1 5.0 7.8 (a) Hedge fund returns are net of fees. Sources: Bloomberg; InvestorInfo Table 3: Performance of Australian Hedge Funds by Type Year to 30 June 2004, per cent(a) Hedge fund type Number of funds Lowest Highest Average 17 3 6 6 2 40 5 2 -15.7 10.0 0.7 -1.1 8.3 -3.3 -5.7 2.6 141.7 25.3 47.9 22.8 8.5 19.2 9.9 5.1 25.4 16.2 15.0 10.0 8.4 7.9 3.9 3.8 Long/short Multi-strategy Managed futures Global macro Event driven Funds of hedge funds Market neutral Arbitrage (a) Hedge fund returns are net of fees. Source: InvestorInfo There has been quite wide dispersion in performance across hedge fund types and across funds of the same type (Table 3). This dispersion is symptomatic of the heterogeneity of hedge funds, but also of the substantial flexibility that hedge fund managers enjoy in their investment activities. The best and worst performing Australian hedge funds in the year to end June 2004 were both long/short equity funds. The volatility of the returns of Australian hedge funds also varies quite substantially (Graph 4). Not surprisingly, reflecting the diversification benefits of FOHFs, single-manager hedge funds have tended to display higher volatility than FOHFs. Over the three-year period, Australian hedge funds, on average, displayed lower volatility than that of the Australian ASX 200 and the US S&P 500 accumulation indices, but higher volatility than the UBS Australian Composite Bond Index. 62 R E S E R V E B A N K O F A U S T R A L I A Conclusion The outperformance of hedge funds relative to major asset-class benchmarks, particularly in an environment of generally low returns, goes some way toward explaining why hedge funds have become more popular in recent years. What is perhaps less well appreciated is the potential for hedge fund returns to be more volatile, and the wide dispersion of returns and volatility across different funds. A key driver of this volatility is the leverage that some funds use. Graph 4 Australian Hedge Fund Returns* Monthly annualised, three years to 30 June 2004 % % Funds of hedge funds 60 60 Single-manager funds 55 55 Benchmarks 30 30 25 25 20 20 15 15 10 10 5 5 ASX 200 0 S&P 500 0 UBS Bond Index -5 0 5 10 15 Volatility (%) 20 25 -5 30 * Hedge fund returns are net of fees. Sources: Bloomberg; InvestorInfo Although the Australian hedge fund industry has been growing rapidly, it is still small relative to the wider funds management industry, and will likely remain a niche market for some time. However, as new investors come to consider this alternative investment class, it is important that they understand the differences in strategy and the risk-return trade-off of hedge funds compared with traditional managed fund products. F I N A N C I A L S T A B I L I T Y R E V I E W | S E P T E M B E R 2 0 0 4 63 Box 1: Description of Hedge Fund Types Long/short Long/short is a strategy which involves combining long holdings of securities that are expected to increase in price with short sales of securities that are expected to decrease in price.6 Long/short portfolios are directional – that is, the investment strategy is based on the manager’s expectation of future movements in the overall market – and may be net long or net short. Short positions are expected to add to the return of the portfolio, but may also act as a partial hedge against market risk. However, long/short portfolios tend to be quite heavily concentrated and thus the effectiveness of the short positions as a hedge against market risk may be limited. Market Neutral Market neutral strategies claim to be non-directional. Market neutral managers attempt to eliminate market risk by constructing portfolios of long and short positions which, when added together, will be largely unaffected by movements in the overall market. Positive returns are generated when the securities which are held long outperform the securities which are held short. Market neutral portfolios tend to be more heavily leveraged than long/short portfolios. Arbitrage Arbitrage strategies involve making non-directional spread trades. Managers take equal long and short positions in two related securities when their prices diverge from their typical relationship. Positive returns are generated when the prices of the two securities reconverge. Because arbitrage opportunities can be limited and the returns from these trades tend to be quite small, arbitrage strategies often employ higher leverage than other funds in an attempt to maximise the profit from exploiting these perceived mispricings. Event Driven Event-driven strategies seek to take advantage of opportunities created by significant corporate transactions such as mergers and takeovers. A typical event-driven strategy involves purchasing securities of the target firm and shorting securities of the acquiring firm in an announced or expected takeover. Profits from event-driven strategies depend on the manager’s success in predicting the outcome and timing of the corporate event. Event-driven managers do not rely on market direction for results; however, major market declines, which might cause corporate transactions to be repriced or unfinished, may have a negative impact on the strategy. 6 Being ‘long’ in a security means that the investor has a net positive holding of that security. Being ‘short’ indicates that the investor has a net negative holding of the security; in order to sell more of a security than was originally owned, an investor would typically borrow the necessary extra amount of the security and then on-sell this. 64 R E S E R V E B A N K O F A U S T R A L I A Global Macro Global macro strategies take leveraged speculative positions in a wide range of global markets, seeking to exploit apparent mispricings. Trading strategies are generally systematic or discretionary; systematic traders tend to use price and market-specific information (often based on technical trading rules) to make trading decisions, while discretionary managers use a judgmental approach regarding differences between current financial market valuations and what is perceived as the ‘correct’ or fundamental valuation. Managed Futures This strategy invests in listed financial and commodity futures markets and currency markets around the world. The managers are usually referred to as Commodity Trading Advisors. Like global macro funds, managed futures funds utilise strategies that are either systematic or discretionary. Multi-strategy The manager utilises two or more specific strategies, although the relative weighting of each may vary over time. Managers may elect to employ a multi-strategy approach in order to better diversify their portfolio or to avoid constraints on their investment opportunities. F I N A N C I A L S T A B I L I T Y R E V I E W | S E P T E M B E R 2 0 0 4 65


