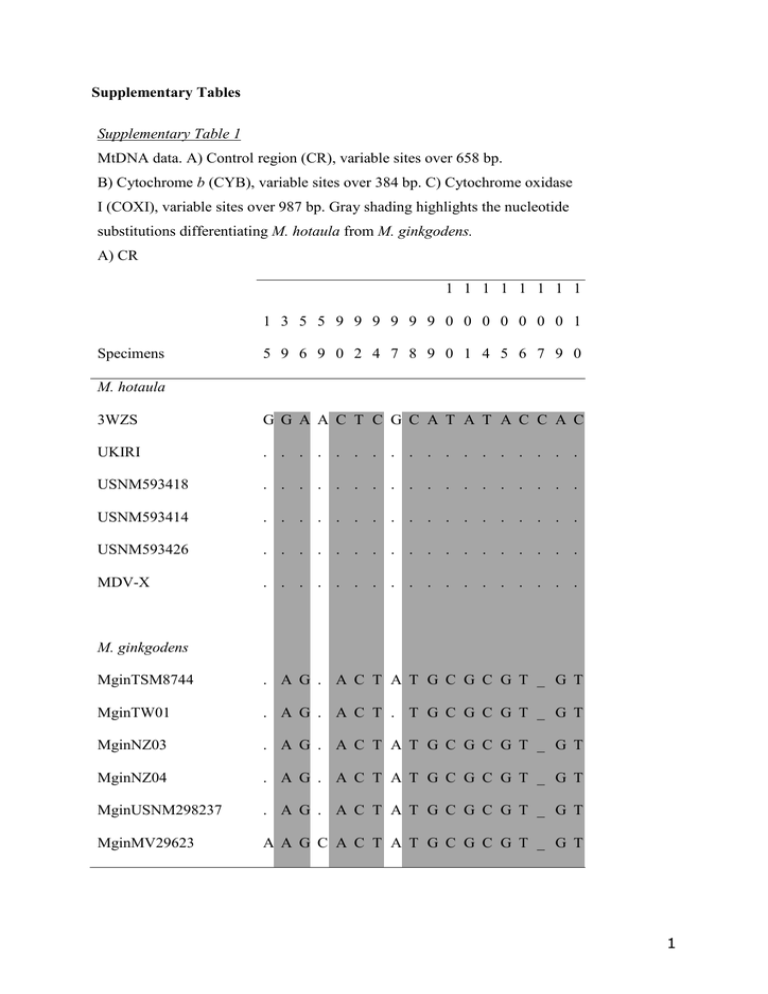
MtDNA data. A) Control region (CR), variable sites over 658... b I (COXI), variable sites over 987 bp. Gray shading highlights... Supplementary Tables
advertisement

Supplementary Tables Supplementary Table 1 MtDNA data. A) Control region (CR), variable sites over 658 bp. B) Cytochrome b (CYB), variable sites over 384 bp. C) Cytochrome oxidase I (COXI), variable sites over 987 bp. Gray shading highlights the nucleotide substitutions differentiating M. hotaula from M. ginkgodens. A) CR 1 1 1 1 1 1 1 1 1 3 5 5 9 9 9 9 9 9 0 0 0 0 0 0 0 1 Specimens 5 9 6 9 0 2 4 7 8 9 0 1 4 5 6 7 9 0 M. hotaula 3WZS G G A A C T C G C A T A T A C C A C UKIRI . . . . . . . . . . . . . . . . . . USNM593418 . . . . . . . . . . . . . . . . . . USNM593414 . . . . . . . . . . . . . . . . . . USNM593426 . . . . . . . . . . . . . . . . . . MDV-X . . . . . . . . . . . . . . . . . . M. ginkgodens MginTSM8744 . A G . A C T A T G C G C G T _ G T MginTW01 . A G . A C T . T G C G C G T _ G T MginNZ03 . A G . A C T A T G C G C G T _ G T MginNZ04 . A G . A C T A T G C G C G T _ G T MginUSNM298237 . A G . A C T A T G C G C G T _ G T MginMV29623 A A G C A C T A T G C G C G T _ G T 1 (A) continued. 1 1 1 1 1 2 2 2 3 3 3 4 4 4 5 5 5 1 1 3 4 4 4 5 7 1 5 6 0 0 3 0 2 9 Specimens 1 3 3 7 8 9 1 9 8 2 3 5 7 9 0 2 9 M. hotaula 3WZS A G C T A T C A T A A C A T A C T UKIRI . . . . . C T G . G T G . C . . . USNM593418 . . . . . C T G . G T G . C . . . USNM593414 . . . . . C T G . G T G . C . . . USNM593426 . . . . . C T G . G T G . C . . . MDV-X . . . . . C T G . . T G . . G T . M. ginkgodens MginTSM8744 G . T C G . . G . G T G . ? ? ? ? MginTW01 G A . C G . . G . G T G . ? ? ? ? MginNZ03 G . T C G . . G C G T G . ? ? ? ? MginNZ04 G . T C G . . G C G T G . ? ? ? ? MginUSNM298237 G . T C G . . G C G T G . ? ? ? ? MginMV29623 G . T C G . . G C G T G G C . . C 2 B) CYB 1 1 1 1 1 1 1 1 3 3 4 6 8 9 2 3 3 3 6 9 9 9 Specimens 6 0 9 5 6 1 0 6 5 6 8 5 0 1 8 M. hotaula UKIRI C A T T T T A T C C C C T C T USNM593418 . . . . . . . C . . . . . . . USNM593426 ? ? ? ? ? ? . C . . . . . . . MM-0001 ? ? ? ? ? ? . C . . . . . . . M. ginkgodens MginTW01 T G C C C C G C T A T T C T . MginNZ03 T . C C C C . C T A T T C T C MginNZ04 T . C C C C . C T A T T C T C MginMV29623 ? ? ? ? ? ? ? C T A T T C T C 3 (B) continued. 2 2 2 2 2 2 2 3 3 3 3 3 3 3 3 3 2 4 4 7 8 8 9 0 2 2 2 3 5 5 6 7 Specimens 5 1 3 9 2 5 4 4 1 4 7 3 4 5 6 5 M. hotaula UKIRI T A C T T T C T C T C T C C G C USNM593418 . . . . . . . . . . . . . . . . USNM593426 . . . . . . . . . . . . . . . . MM-0001 . . . . . . . . . . . . . . . ? M. ginkgodens MginTW01 C T . C C C T C T C T A T T A T MginNZ03 C T T C C C T C T C T A T T A T MginNZ04 C T . C C C T C T C T A T T A T MginMV29623 C T . C C C T C T C T A T T A T 4 C) COX I Specimens 5 1 1 1 1 2 2 2 2 2 2 2 2 3 2 2 3 7 8 9 9 9 1 1 4 7 0 1 3 4 6 8 9 9 5 0 7 3 1 6 5 6 8 4 9 3 3 6 9 6 2 9 5 3 9 9 M. hotaula UKIRI C T T C C C A T A C T A C C T T A C C C T A M. ginkgodens MginTW01 T C T . . MginNZ03 T C C T . T G C G T C G T A C C MginNZ04 T C C T T T G C G T C . 3 3 3 4 4 4 4 4 4 4 4 6 7 8 0 1 1 2 2 2 5 8 7 0 7 3 6 3 5 9 0 Specimens . G C G T C . T A C . C T T . A G . T T T A . T A C C . T T T A . 4 4 5 5 5 5 5 5 6 6 6 7 8 9 1 2 2 3 4 9 0 2 2 3 5 4 5 1 7 0 5 9 3 6 9 M. hotaula UKIRI T A T T C C T G T T G T T G C T A T A C A T M. ginkgodens MginTW01 C . C C T T C A . C A C . A T C G C . T G C MginNZ03 C G C C T T C A C C A C C A T C G C G T . C MginNZ04 C G C C T T C A . . C C A C C A T C G C G T 5 (C) continued. 6 6 7 7 7 7 7 7 8 8 8 8 8 8 8 8 8 9 9 9 6 8 1 1 3 5 7 8 0 1 2 2 3 6 7 7 8 1 2 5 Specimens 2 9 3 7 1 2 9 8 6 5 1 2 3 0 2 5 7 7 0 3 M. hotaula UKIRI T T A T A T T A A T C T T C T T T T T G M. ginkgodens MginTW01 C C G C G C C G G C T C C T . C C C C . MginNZ03 C C G C G C C G G C T C C T C C C C C A MginNZ04 C C G C G C C G G C T C C T C C C C C A 6 Supplementary Table 2. Pairwise net divergence between species, Kimura 2-parameter distances, as percentages, below diagonal. SE, above diagonal. Values for sister-species pairs highlighted in gray with bold type. (A) Control region, CR (435 bp); (B) cytochrome b, CYB (384 bp); (C) cytochrome oxidase I, COXI (958 bp). See footnotes of Supplementary Table 2A for translation of species codes. (A) CR Mhot Mhot Mgin Mbi Mbow Mca Mde Meu Mhe Mlay Mgr Mmi Mperu Mpi Mst Mtr 3.57 4.40 5.48 4.85 4.87 4.95 3.11 4.88 6.22 4.77 4.90 4.66 5.22 5.72 Mgin 0.910 5.89 6.18 5.92 6.26 6.23 4.50 5.78 7.20 5.94 6.25 5.95 6.90 6.67 Mbi 1.030 1.230 5.75 5.25 6.08 3.36 4.25 4.89 5.84 4.80 5.31 5.53 5.01 5.50 Mbow 1.110 1.220 1.130 5.21 6.67 5.54 5.22 5.76 6.80 6.73 6.43 6.68 8.33 6.41 Mca 0.970 1.140 1.060 1.050 5.92 5.19 4.85 4.65 6.13 5.97 4.33 5.08 5.70 4.47 Mde 1.080 1.280 1.260 1.300 1.200 6.49 5.91 6.37 4.86 6.80 3.75 4.32 3.58 6.17 Meu 1.050 1.220 0.860 1.080 1.050 1.240 3.32 4.78 5.59 3.67 5.59 6.00 5.57 5.90 Mhe 0.830 1.060 1.010 1.080 1.010 1.220 0.870 3.80 5.05 4.39 5.43 5.60 4.29 5.08 Mlay 1.060 1.170 1.080 1.210 1.070 1.240 1.080 0.950 6.50 6.05 6.21 6.37 5.39 5.67 Mgr 1.300 1.380 1.180 1.300 1.210 1.060 1.090 1.120 1.240 5.90 3.92 4.53 5.62 8.06 Mmi 1.020 1.160 1.000 1.210 1.120 1.250 0.870 0.960 1.170 1.160 6.15 5.99 5.02 6.27 Mperu 1.070 1.250 1.100 1.240 0.990 0.950 1.100 1.110 1.210 0.950 1.160 3.20 4.32 6.39 Mpi 1.050 1.250 1.180 1.250 1.120 0.990 1.200 1.170 1.240 1.070 1.120 0.830 4.75 6.10 Mst 1.130 1.360 1.140 1.480 1.200 0.900 1.170 1.060 1.180 1.170 1.020 0.960 1.020 Mtr 1.180 1.300 1.140 1.230 1.020 1.190 1.190 1.130 1.170 1.400 1.180 1.210 1.180 1.120 5.48 Mhot, M. hotaula; Mgin, M. ginkgodens; Mbi, M. bidens; Mbow, M. bowdoini; Mca, M. carlhubbsi; Mde, M. densirostris; Meu, M. europeaus; Mhe, M. hectori; Mlay, M. layardii; Mgr, M. grayi; Mmi, M. mirus; Mperu, M. peruvianus; Mpi, M. perrini; Mst, M. stejnegeri; Mtr, M. traversii. 7 (B) CYB Mhot Mhot Mgin Mbi Mbow Mca Mde Meu Mgr Mhe Mlay Mmi Mpi Mperu Mst Mtr 8.24 12.19 11.95 10.66 11.58 8.87 10.59 12.38 9.49 5.54 13.75 13.53 12.80 12.77 Mgin 1.790 13.86 13.43 13.99 12.38 9.97 11.72 10.40 12.47 9.76 10.88 11.40 10.49 13.85 Mbi 2.290 2.420 12.13 11.22 9.94 13.92 12.37 10.67 12.62 7.21 15.54 11.69 9.76 10.95 Mbow 2.300 2.450 2.250 11.77 11.32 10.30 12.48 13.78 11.85 8.65 16.13 14.58 12.77 13.25 Mca 2.010 2.370 2.160 2.240 10.58 11.49 10.48 11.11 8.82 10.32 13.55 11.91 10.76 10.32 Mde 2.110 2.180 2.050 2.110 1.970 11.58 7.39 10.01 10.41 8.31 11.15 10.43 10.39 13.65 Meu 1.900 2.040 2.480 2.150 2.120 2.130 10.15 12.35 10.72 8.68 12.58 10.04 11.24 12.43 Mgr 2.060 2.120 2.400 2.370 2.040 1.680 2.000 11.14 10.78 9.04 10.17 8.87 9.60 13.42 Mhe 2.300 2.060 2.110 2.550 2.130 2.040 2.350 2.150 9.87 9.83 12.47 14.13 12.45 11.03 Mlay 1.890 2.220 2.380 2.240 1.860 2.030 2.080 2.130 2.000 5.53 13.28 11.40 13.64 12.52 Mmi 1.330 1.940 1.650 1.830 1.990 1.740 1.850 1.830 2.000 1.420 11.61 10.01 10.10 10.26 Mpi 2.310 2.040 2.610 2.610 2.290 2.080 2.180 1.950 2.280 2.280 2.120 11.68 11.18 16.60 Mperu 2.330 2.120 2.210 2.580 2.190 2.050 1.980 1.810 2.520 2.220 2.000 2.240 10.89 15.71 Mst 2.220 2.020 1.940 2.350 2.070 2.010 2.210 1.920 2.270 2.470 1.920 2.080 2.100 Mtr 2.310 2.590 2.040 2.480 2.020 2.400 2.270 2.430 2.130 2.280 1.990 2.720 2.630 2.130 11.41 8 (C) COXI Mhot Mhot Mgin Meu Mmi Mde 5.52 9.36 7.59 9.58 Mgin 0.760 8.03 9.06 9.34 Meu 1.050 0.930 7.76 9.95 Mmi 0.830 0.950 0.900 Mde 1.040 1.040 1.100 0.920 8.45 9 Supplementary Table 3. Y-chromosome intron, DBY7. Variable sites over 241 bp. The diagnostic nucleotide substitutions that distinguish M. ginkgodens and M. hotaula from each another, and from the other Mesoplodon species sampled are highlighted in gray. 1 1 1 1 1 1 1 1 1 2 3 5 6 6 6 8 0 2 2 2 4 5 8 9 9 0 Speciesa, b 4 3 0 2 7 1 5 3 4 5 6 6 9 1 2 3 M. bowdoini G C G T T A C _ _ _ C G C C C T M. carlhubbsi . . . . . . . _ _ _ . . . . . . M. layardii . . . . . . A _ _ _ . . . . . . M. stejnegeri . . . C . . . T T T . . . . . . M. grayi . . . . . . T _ _ _ . . . . . M. perrini . . . . . . . _ _ _ T . . . . . M. hectori . . T . . . . _ _ _ . . . . . . M. europaeus . T . . . G . _ _ _ . . . . . . M. mirus . . . . . . . _ _ _ . . . . . . M. hotaula . . . . C . . _ _ _ . C . . . C M. ginkgodens . . . . C . . _ _ _ . . . T . C M. bidens A . . . . . _ _ _ . . . . . a . . . Missing M. densirostris, M. peruvianus, and M. traversii. b GenBank Accession No’s: KF027328-KF027337. 10 Supplementary Table 4A. Cranial measurements for Mesoplodon hotaula. Measurements (in mm) are taken on the right hand side (R) where possible, following Moore (1963). Where two measurements are given, R, then L. E, estimated length. See Supplementary Table 3B for definitions of measurements. 3WZS USNM593418 USNM593414 USNM593426 MDV-X Deraniyagala (1963a), Mead, this paper Mead, this paper Mead, this paper Anderson, this paper adult F adult F subadult F? adult M adult M 735 680E 615E 735 721 2 604E 528E 678, 677 3 463E 406E 521 4 450E 404E 553, 550 5 516E 462E 606 6 620E, 612E 581E, _ 695, 693 7 339E 323E 403 8 323 282 348 9 346 284 372 Anderson, this paper Measurement number 1 11 10 355 361E 284 360 11 233 _ 237 12 288 262 _ 13 114 91 111 14 44 31 41, 47 15 71, 73 56, 56 70, 74 16 42 36 42 17 65 69 89 18 42 45 48 19 3 -10 0 20 47 53 58 21 28 _ 21 22 151 137 161 23 47 58 57 24 116 104 112 25 115 104 117 26 126E 13 158 12 27 211 197 288 28 89 _ 94 29 34 33 38 30 75 62 71 31 _ _ 8 67 63 61 33 58 39 45 34 183 194 20 284 249 279 36 102, 100 104E 103, 97 37 53, 54 _ 55, 67 38 99, 94 82 87, 100 39 372E 352E 364 40 327E, 336E 290, 290 411, 410 41 298E 275 364 42 459E _ 573 43 _ _ 607 32 35 60.2 280 13 44 _ _ 117 45 107 _ 91 46 79 36 0 Notes skull extremely incomplete skull excellent skull, damaged, burned pathology on right lateral exo occipital (abcess) 14 Supplementary Table 4B. Definitions of cranial measurements. Numbers in parentheses refer to Moore (1963). 1 – condylobasal length (1) 2 – tip rostrum to posterior extension maxillary plate (7) 3 – tip rostrum to anterior margin superior nares (8) 4 – tip rostrum to anterior point maxillary crest (9) 5 – tip rostrum to posterior extension premaxilla on lateral tip of right premaxillary crest (11) 6 – tip rostrum to posterior extension temporal fossa (10) 7 – tip rostrum to apices of antorbital notches (2) 8 – breadth skull across orbital centres (19) 9 – breadth skull across postorbital process frontals (17) 10 – breadth skull across zygomatic processes squamosals (18) 11 – least breadth skull across posterior margins temporal fossae (20) 12 – greatest breadth skull across ex-occipitals (25) 13 – greatest span occipital condyles (21) 14 – greatest width of an occipital condyle (22) 15 – greatest length of an occipital condyle (23) 16 – greatest breadth foramen magnum (24) 17 – greatest length of right nasal on vertex (15) 18 – length nasal suture (16) 19 – extension right premaxilla posterior to right nasal on vertex (28) 20 – greatest breadth nasals on vertex (26) 21 – least distance between anterior prominences of the synvertex (27) 22 – greatest span premaxillary crests (29) 23 – greatest transverse width of superior nares (37) 15 24 – least width premaxillae where narrow opposite superior nares (30) 25 – greatest width premaxillae anterior to position of previous (31) 26 – width rostrum in apices of antorbital notches (33) 27 – width rostrum in apices of prominential notches (34) 28 – least distance be- tween main maxillary foramina (41) 29 – least distance between premaxillary foramina (42) 30 – distance posterior margin of left maxillary foramina to anterior margin maxillary prominence (43) 31 – width rostrum at mid-length of rostrum (35) 32 – width premaxillae at mid-length of rostrum (32) 33 – depth rostrum at mid-length rostrum (36) 34 – height of skull (39) 35 – external cranial height 36 – greatest length of temporal fossa (13) 37 – width of temporal fossa (40) 38 – length of orbit taken from mid-point of frontals (14) 39 – tip rostrum to posterior extension of maxilla between pterygoids (6) 40 – tip rostrum to anterior extension of pterygoid sinus (12) 41 – tip rostrum to most anterior extension of pterygoids (5) 42 – tip rostrum to posterior margin of pterygoid mid-line (3) 43 – tip rostrum to posterior extension of wing of pterygoid (4) 44 – length of vomer visible at surface of palate (44) 45 – width between pterygoid notches (38) 46 – amount added to rostrum because of breakage (45) 16 Supplementary Table 5A. Mandibular measurements for Mesoplodon hotaula. Measurements (in mm) are taken on the right hand side (R) where possible, following Moore (1963). Where two measurements are given, R, then L. E, estimated length. See Supplementary Table 4B for definitions of measurements. Measurement number 3WZS USNM593418 USNM593426 MDV-X Deraniyagal (1963a) Mead, this paper Mead, this paper Anderson, this paper adult F adult F adult M adult M 631 618E 620, 610 610, 615 48 491 493, 496 49 427 383, 377 50 137 139, 139 51 108 110, 114 52 49 88, 98 53 50, 49 _, 74 54 23, _ 89, 93 55 10, _ _, 18 47 17 56 168, _ 168, 167 57 45 54 L _ 88, 90 58 54 60 L _ 57, 60 59 17 L _ 60 20 L _ 61 143 g L _ 62 170 200 Notes mandible broken, left 200 mm added to missing 170 mm mandibles due to breakage 18 Supplementary Table 5B. Definitions of mandibular measurements. Numbers in parentheses refer to Moore (1963). 47 –mandibular length (1) 48 – length from posterior extension of symphysis to condyles (6) 49 – length posterior margin of alveolus to condyles (7) 50 – greatest length of symphysis (2) 51 – greatest height of mandible at coronoid processes (3) 52 – outside height of mandible at midlength of alveolus (4) 53 – inside height of mandible at midlength of alveolus (5) 54 – length of alveolus (8) 55 – width of alveolus (9) 56 – tip of mandible to alveolus (10) 57 – greatest tooth length (11) 58 – greatest tooth width (12) 59 – greatest tooth breadth (13) 60 – height of crown of tooth 61 – tooth weight 62 – amount added to mandibles due to breakage 19


