Managing Wildland Fires Pacific Southwest Research Station
advertisement
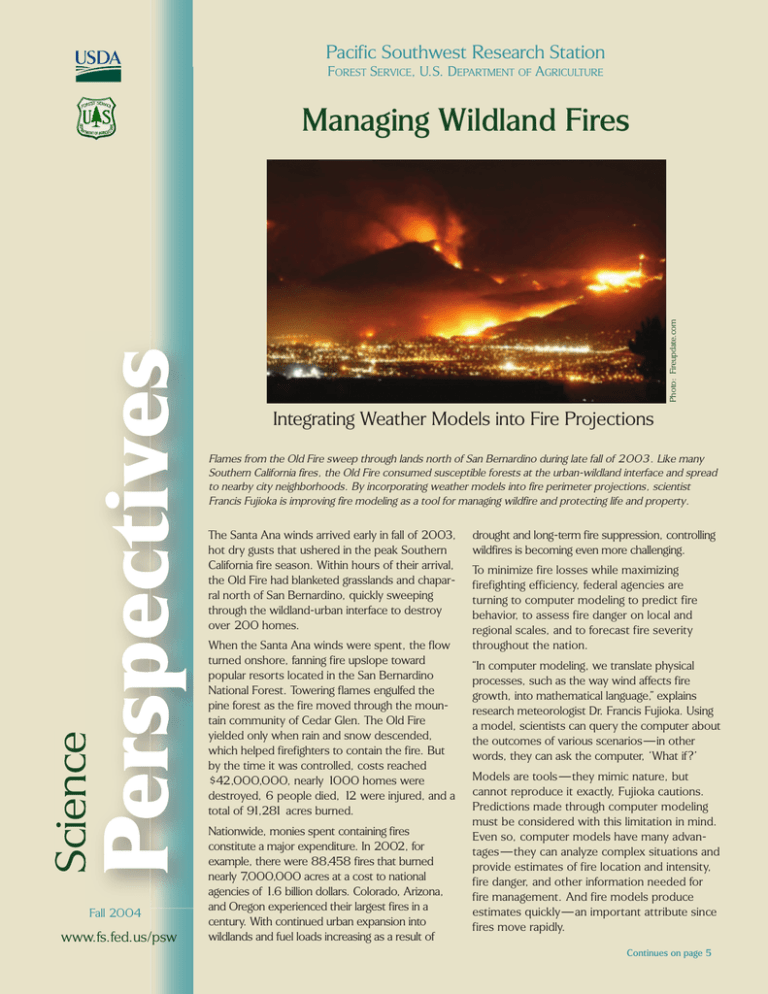
Pacific Southwest Research Station FOREST SERVICE, U.S. DEPARTMENT OF AGRICULTURE Photo: Fireupdate.com Managing Wildland Fires Integrating Weather Models into Fire Projections Flames from the Old Fire sweep through lands north of San Bernardino during late fall of 2003. Like many Southern California fires, the Old Fire consumed susceptible forests at the urban-wildland interface and spread to nearby city neighborhoods. By incorporating weather models into fire perimeter projections, scientist Francis Fujioka is improving fire modeling as a tool for managing wildfire and protecting life and property. Science The Santa Ana winds arrived early in fall of 2003, hot dry gusts that ushered in the peak Southern California fire season. Within hours of their arrival, the Old Fire had blanketed grasslands and chaparral north of San Bernardino, quickly sweeping through the wildland-urban interface to destroy over 200 homes. Fall 2004 www.fs.fed.us/psw When the Santa Ana winds were spent, the flow turned onshore, fanning fire upslope toward popular resorts located in the San Bernardino National Forest. Towering flames engulfed the pine forest as the fire moved through the mountain community of Cedar Glen. The Old Fire yielded only when rain and snow descended, which helped firefighters to contain the fire. But by the time it was controlled, costs reached $42,000,000, nearly 1000 homes were destroyed, 6 people died, 12 were injured, and a total of 91,281 acres burned. Nationwide, monies spent containing fires constitute a major expenditure. In 2002, for example, there were 88,458 fires that burned nearly 7,000,000 acres at a cost to national agencies of 1.6 billion dollars. Colorado, Arizona, and Oregon experienced their largest fires in a century. With continued urban expansion into wildlands and fuel loads increasing as a result of drought and long-term fire suppression, controlling wildfires is becoming even more challenging. To minimize fire losses while maximizing firefighting efficiency, federal agencies are turning to computer modeling to predict fire behavior, to assess fire danger on local and regional scales, and to forecast fire severity throughout the nation. “In computer modeling, we translate physical processes, such as the way wind affects fire growth, into mathematical language,” explains research meteorologist Dr. Francis Fujioka. Using a model, scientists can query the computer about the outcomes of various scenarios—in other words, they can ask the computer, ‘What if?’ Models are tools—they mimic nature, but cannot reproduce it exactly, Fujioka cautions. Predictions made through computer modeling must be considered with this limitation in mind. Even so, computer models have many advantages—they can analyze complex situations and provide estimates of fire location and intensity, fire danger, and other information needed for fire management. And fire models produce estimates quickly—an important attribute since fires move rapidly. Continues on page 5 From Science... Major Themes Saving Lives and Property: Reducing the risk associated with wildland fires is essential— wildfires burn millions of acres each year and use of prescribed fire is rising. Reducing Costs: With firefighting requiring well over a billion dollars each year, cost reduction is a priority. Computer Modeling: Computer modeling will be a key USDA Forest Service tool for improving fire suppression and containment, planning strategies in advance, designing prescribed burns, and allocating firefighting resources. Research Results Weather Models: By using weather models in tandem with fire models, scientists can provide more accurate fire projections for wildlands, and they can provide projections more frequently. Greater Detail: Fire projections based on weather models contain higher resolution— that is, they contain more spatial and temporal detail. Increasing Accuracy: A third type of model gives scientists insight about error, which is the difference between the projected and actual fire behavior. Error modeling helps scientists increase projection accuracy. By using weather models to provide input data, Fujioka is improving the effectiveness of fire models used in three arenas of wildfire management—fire behavior prediction, fire danger rating, and fire severity forecasting. Fire Behavior Prediction The most widely used computer model in the US for predicting two-dimensional fire spread is FARSITE, developed by Mark A. Finney, USDA Forest Service Rocky Mountain Research Station. With FARSITE, fire scientists and managers can project how an active wildfire will behave, as well as study numerous scenarios when planning controlled burns. Through the integration of weather and fire behavior models, Fujioka hopes to increase the accuracy of FARSITE predictions, especially in areas where variable terrain causes weather changes over short distances. Most recently he piloted this approach for the Old Fire, which occurred in Southern California in 2003. Current fire models project likely fire perimeters, but don’t indicate their reliability. To further improve the usefulness of fire behavior models, Fujioka, Shyh-Chin Chen and David Weise, USDA Forest Service, and Charles Jones, University of California, Santa Barbara, are studying the nature of the error between predicted and Computer-generated three-dimensional image depicts the behavior of four simulated fires in the San Bernardino National Forest near Lake Arrowhead. The white outlines show fire perimeters projected over time 6, 12, and 18 hours after ignition. The colors indicate fuel type: red-chaparral, greengrasslands, dark blue-conifer forest, light blue-water. The FARSITE fire model accounts for differences in fire growth due to fuel type, topography, and weather. Pacific Southwest Research Station 2 actual fire perimeters. Their goal is to develop yet a third model—one that associates a probability with each prediction of perimeter location. For example, the combined model might predict with 75 percent probability that the fire front would lie within a particular zone 24 hours in the future. The added information provides the fire manager with a sense of the quality of the model prediction. Fire Danger Rating While fire behavior projections are sitespecific for an existing fire, fire danger ratings are broad-scale assessments of fire risk due to terrain, fuel, and weather conditions. These ratings indicate the potential for a fire to ignite and spread, and they describe the potential fire intensity. Federal and state agencies use the National Fire Danger Rating System (NFDRS) to indicate fire danger. Wildland managers consider fire danger when making decisions regarding personnel levels, contingency resources, and pre-positioning fire-fighting equipment. Day-to-day land use decisions also depend on fire danger ratings; for instance, managers may prohibit industrial activities such as logging when fire danger ratings are high. Categorical fire danger ratings are often based on the NFDRS Burning Index (BI), Fire Behavior Prediction time series: the white arrows indicate wind direction and speed; the white lines indicate fire perimeters. Six hours after ignition— winds blowing from the north-to-northeast typify the autumn Santa Ana winds. which takes into account how quickly a fire would spread and how much energy it would radiate. The BI indicates potential flame length and how difficult it would be to suppress a fire once started. Season, topography, and fuel load all factor into the fire danger rating. Weather influences are also critical, as measured by temperature, relative humidity, precipitation, and wind velocity. Currently, authorities assess fire danger for areas encompassing similar climate, topography, and fuels, using weather data from traditional forecasts. “By incorporating a weather model into fire danger ratings, scientists can update ratings on an hourly instead of a daily basis and paint a more detailed picture of fire danger,” Fujioka says. With finer resolution, fire danger can be depicted on a landscape image divided into a finely spaced grid. Fujioka is currently working on a revision of the fire danger rating system for the State of Hawaii, in conjunction with the Hawaii Division of Forestry and Wildlife, the United States Army, the Pacific Disaster Center, and the National Park Service. Fire Severity Forecasting Fire severity forecasting plays an essential role in how fire-fighting resources are allocated on national and regional bases. Coordination of these resources, ranging Twelve hours after ignition—the winds are lighter with variable direction. Fire Danger Rating: The new interactive Hawaii Fire Danger Rating System is now being tested. This image shows relative humidity over the northern portion of the island of Hawaii as predicted by a weather model. Scientists and managers can display a variety of fire-related data while customizing the map type, scale, and features. from aircraft to specially trained personnel, takes place in Boise, ID, at the National Interagency Coordination Center. Severity forecasting is also incorporated into many aspects of prescribed fire and general land management. Fire severity forecasts are indicated on a map of the United States and are available over the Internet. National Fire Danger Rating System. The new method generates predictions more frequently and provides a 16- week forecast, an improvement over the former 4-week forecasts. Using a weather model also makes possible forecasts with greater geographical detail over a 2-week period for regional centers. Fujioka’s current research includes using weather models to provide the meteorological data needed in fire severity forecasting. His colleagues in this endeavor include Chen and John Roads, Scripps Institution of Oceanography. With this new approach, the forecast format now provides long-range weather inputs to the Eighteen hours after ignition—winds are now blowing from the south near the grasslands (green), accelerating fire spread into that area. Pacific Southwest Research Station 3 To improve a computer model of fire behavior prediction, projected perimeters are compared to the actual summer, 1996 Bee Fire. Rust is the fire location approximately 10 minutes after ignition. Pink indicates the actual fire 45 minutes after ignition, with yellow the simulated fire. Mustard indicates how the fire perimeter might vary from that predicted by the model with 95 percent probability. The grid runs north/south from upper left to lower right; grid lines are spaced at one mile. ...To Manag ement A Conversation with Francis Fujioka Q Currently available fire models predict the perimeters of active fires over time. In the near future, how will your research affect the way these models are used? Using high-resolution weather models in conjunction with FARSITE should provide more accurate fire predictions, especially over mountainous and other highly variable terrain. Weather-model projections for temperature, relative humidity, and wind velocity extend continuously through a 48-hour period. This means that the weather data input into the fire model will contain far greater spatial and temporal details than a human forecaster could provide, especially on short notice during emergency situations. Q Q Our goal is to continually renew information available to fire managers on a realtime basis. We can monitor the actual growth of wildfires with new systems such as the FireMapper™ Thermal Imager, a remote sensing system codeveloped by Phil Riggan of the USDA Forest Service Pacific Southwest Research Station and Space Instruments, Inc. The FireMapper images the longwave infrared radiation released by a wildfire and thus “sees” the fire through smoke. Using a weather model in combination with FireMapper perimeter data, we can continuously update FARSITE projections of fire growth as well as track the accuracy of model predictions. We are currently testing these techniques on California wildfires. Fire danger rating helps local departments allocate resources and assists wildland managers in making land-use decisions related to fire hazard. What improvements do you foresee for fire danger rating on a local basis? Our use of high-resolution weather models will provide information at a much finer scale, making fire danger rating more precise for local decision making. It should give wildland managers more flexibility to adjust use guidelines and constraints to local conditions. Higher temporal resolution will alert managers to rapidly changing, potentially dangerous conditions. Fire Behavior: Weather models can be used with the FARSITE computer model, commonly used to project fire growth. Real-time Basis: The ultimate goal is real-time projections of fire growth. These will use meteorological data from a weather model and fire perimeter data from remote sensing systems. Fire Danger Rating: Incorporation of weather models will provide grid-based information at a finer scale and provide more frequent updates. Fire Severity Forecasting: Using weather models to provide meteorological data will lead to longer projections and make it possible to indicate seasonal severity with the National Fire Danger Rating System. Air Quality Applications: Scientists are developing ways to use weather models to project how wildfires affect air quality. Chandler Burning Index 08/01/2004 - 08/31/2004 97.5 On a national scale, managers use fire severity forecasts as one of their planning tools to locate and distribute fire-fighting resources, such as emergency firefighting funds, equipment, and specially trained personnel. What are the advantages of incorporating a weather model into these forecasts? 90.0 Weather models can provide short-term, two-week weather forecasts at high resolution on a regional basis. These permit fire severity forecasts using the National Fire Danger Rating System, an improvement over the current severity forecasts, which use an independent rating system. Our research models can also generate coarser resolution weather forecasts for an entire season. Longterm severity forecasts based on the coarser resolution data also use the National Fire Danger Rating System. 50.0 75.0 Forecast Energy Release Component Anomalies, August 2004 Forecast prepared July, 31, 2004 Q Are there other applications of weather models that are important to forest 10 9 8 7 6 5 4 3 2 1 0 -1 -2 -3 -4 -5 -6 -7 -8 -9 -10 management? The spread of smoke particles from forest fires can pose a health hazard downwind. The Fire Consortia for Advanced Modeling of Meteorology and Smoke (FCAMMS), which include the Riverside Fire Laboratory, are using weather models to project this spread. In addition, by testing various scenarios, scientists may be able to establish the weather conditions acceptable for conducting controlled burns at specific locations while still addressing air quality concerns. For example, burns could be prohibited under conditions where wildfire smoke would cause the particulate concentrations in nearby urban areas to exceed air quality standards. 4 Fire Severity Forecasting: the current method for projecting fire severity nationwide (top map), which uses statistical models, will be replaced by a new method that uses weather models (lower map). On both maps, red indicates higher than normal fire potential; green indicates lower than normal potential. Pacific Southwest Research Station Scientist Profile Continued from front page this tenure that Fujioka began investigating high-resolution weather models for data input into fire-behavior models. Since 1988, Fujioka has been a technical advisor to the National Fire Danger Working Team on implementation of research findings related to fire weather and fire climatology problems. In addition, Fujioka has worked with the Boise Interagency Fire Center, developing the monthly fire-weather forecasts that are incorporated into national projections of fire severity. Photo: Gayle Fujioka: Francis Fujioka Ph.D. Forest Fire Laboratory Pacific Southwest Research Station USDA Forest Service 4955 Canyon Crest Drive Riverside, CA 92507 Phone: 951-680-1552 e-mail: ffujioka@fs.fed.us www.fs.fed.us/psw/topics/fire_science/fire_weather “Real-world outcomes can be difficult to predict,” says meteorologist Francis Fujioka. “My reliance on statistical theory has made me more comfortable working with uncertainties of forecasts.” Fujioka’s long-time fascination with weather models reflects his drive to optimize predictions that factor into important decisions in fire management. In collaboration with colleagues, Fujioka established the first long-range fire weather forecasting system from 1987 to 2003 as Project Leader, Fire Meteorology Project, USDA Forest Service Fire Laboratory, Riverside, CA. It was during As a principal investigator under the National Fire Plan, Fujioka is one of six scientists funded to establish the Fire Consortia for Advanced Modeling of Meteorology and Smoke (FCAMMS), heading up the research program for California, Nevada, and Hawaii. In a new role, Fujioka is serving on the Committee on Agricultural Meteorology for the United Nations World Meteorological Organization, developing strategies for managing wildfire in developing countries. Fujioka gained forecasting experience by preparing weather forecasts for military operations as a member of the Air Force Reserve and Air National Guard in California and Hawaii. Fujioka received his Ph.D. from the University of California, Riverside, in Earth Sciences. Additionally, he holds two M.S. degrees, one in Meteorology from the University of Hawaii and a second from the University of California, Berkeley in Statistics. Fujioka first combined his interests in mathematics and science while studying for his B.S. in Geosciences at the University of Hawaii. Fire models require specific data, such as topography, fuel load, climate, and weather. The veracity of this data is one of the keys to accurate responses to the “What if?” question. The weather components—temperature, relative humidity, precipitation, and wind direction and speed—constitute especially important variables in fire modeling. Traditionally, fire scientists glean weather data from measurements and forecasts made by meteorologists. Yet in many wildland areas, forecasts are limited or unavailable. And where forecasts can be used, they tend to cover wide swaths of land, without taking into account dramatic local variations such as those caused by topography. A recent advance in fire modeling, led by Fujioka, harnesses a second model to obtain weather information. Weather models start with general forecasts from the National Weather Service. By taking into account a range of factors from atmospheric physics to variations in terrain, the models generate weather projections with higher resolution—that is, more detail on how weather varies over a given geographical area—than traditional forecasts. Writer Anne M. Rosenthal holds B.S. and M.S. degrees in Biological Sciences from Stanford University and a Certificate in Technical Writing from San Jose State University. A science writer based in the San Francisco Bay Area, she served as editor of Jasper Ridge Views, a publication of the Stanford University Jasper Ridge Biological Preserve, for ten years. Her articles have been published in Scientific American On-line, Astrobiology Magazine (NASA), and California Wild (California Academy of Sciences). Pacific Southwest Research Station 5 Using Geographic Information Systems (GIS) significantly enhances visual images of weather and fire predictions. Forecast maps, such as this 3dimensional image, depict the geographic relationship between fire progression, terrain, and resources at risk. For Further Reading What’s Next Chu, P.-S.; Yan, W.; Fujioka, F. 2002. Fire-climate relationships and long-lead seasonal wildfire prediction for Hawaii. International Journal of Wildland Fire 11: 25-31. By continuing their analysis of the differences between predicted and actual fire perimeters, Fujioka and colleagues plan to further characterize errors in fire behavior forecasts based on models. Where this error has a systematic bias, the scientists plan to adjust their models to negate or account for the bias. Fujioka, F.M. 1997. High resolution fire weather models. Fire Management Notes 57: 22-25. Fujioka, F.M. 1998. PEGASUS: An integrated weather wildfire modeling system. In: Proceedings, 2nd Symposium on Fire and Forest Meteorology; American Meteorological Society; Jan. 1998; Phoenix, AZ; 38-41. Work also will continue toward providing probabilities with projections of fire perimeters. These probabilities will indicate the likelihood that fire growth actually falls within the boundaries predicted by fire modeling. A long-range goal is to provide risk assessments by tying the boundary predictions and probabilities with the location and value of assets such as commodities, buildings or endangered-species habitat. Fujioka is also continuing work on the long-range predictions associated with fire severity forecasting. By analyzing the nature of fire severity forecasting errors, Fujioka and colleagues hope to improve accuracy of the forecasts and help decision makers cope with the uncertainties involved in the forecasting. 0 Photo Credit: Crest Forest Fire District A top priority is giving local fire districts a more detailed and timely picture of fire danger by incorporating weather models into the fire danger rating process. The anticipated end product will display fire danger over the landscape at a finer resolution and will update on a regular basis. Fujioka, F.M. 2002. A new method for the analysis of fire spread modeling errors. International Journal of Wildland Fire 11: 193-203. The Old Fire, fall 2003, San Bernardino National Forest. Published by Pacific Southwest Research Station, USDA Forest Service James R. Sedell, Station Director 800 Buchanan Street, Albany, CA 94710 • 510-559-6300 • http://www.fs.fed.us/psw The United States Department of Agriculture (USDA) prohibits discrimination in all its programs and activities on the basis of race, color, national origin, gender, religion, age, disability, political beliefs, sexual orientation, and marital or familial status. (Not all prohibited bases apply to all programs.) Persons with disabilities who require alternative means for communication of program information (Braille, large print, audiotape, etc.) should contact USDA’s TARGET Center at: 202-720-2600 (voice and TDD) To file a complaint of discrimination, write: USDA Director. Office of Civil Rights, Room 326-W, Whitten Building, 14th & Independence Avenue, SW, Washington, DC 20250-9410, or call: (202) 720-5964 (voice or TDD), USDA is an equal opportunity provider and employer. USDA is committed to making its information materials accessible to all USDA customers and employees. Pacific Southwest Research Station USDA Forest Service P.O. Box 245 Berkeley, CA 94701 Fujioka, F.M.; Weise, D.R.; Burgan, R.E. 2000. A high resolution fire danger rating system for Hawaii. In: Proceedings, 3rd Symposium on Fire and Forest Meteorology; American Meteorological Society; Jan. 2000; Long Beach, CA; 103-106. Jones, C.; Dennison, P.E.; Fujioka, F.M.; Weise, D.R.; Benoit, J.W. 2003. Analysis of space/time characteristics of errors in an integrated weather/fire spread simulation. In: Proceedings, 5th Symposium on Fire and Forest Meteorology; American Meteorological Society; Nov. 2003; Orlando, FL; J2.8: 1-7. Roads, J.O.; Chen, S.-C.; Fujioka, F. 2001. ECPC’s [Experimental Climate Prediction Center] weekly to seasonal global forecasts. Bulletin of the American Meteorological Society 82: 639-658. Ueyoshi K.; Roads, J.O.; Fujioka, F.; Stevens, D.E. 1996. Numerical simulation of the Maui vortex in the trade winds. Journal of the Meteorological Society of Japan 74: 723-744. Web Resources High resolution fire weather forecasts http://www.icess.ucsb.edu/asr/mm5_forecasts.htm http://www.cefa.dri.edu/COFF/coffframe.html http://weather.mhpcc.edu/ Monthly and seasonal fire weather forecasts http://www.fs.fed.us/psw/topics/fire_science/fire_weather/ mfwf/MFWF.shtml http://ecpc.ucsd.edu/projects/fire.html
