Time Acceleration Factor Profiler User Guide
advertisement

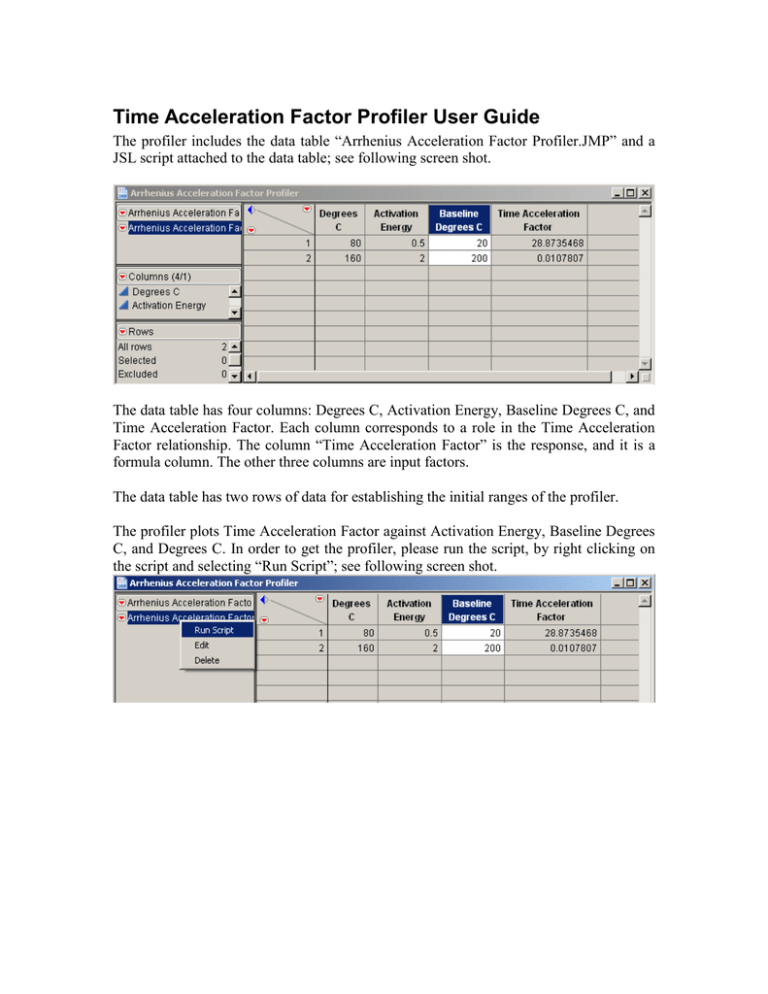
Time Acceleration Factor Profiler User Guide The profiler includes the data table “Arrhenius Acceleration Factor Profiler.JMP” and a JSL script attached to the data table; see following screen shot. The data table has four columns: Degrees C, Activation Energy, Baseline Degrees C, and Time Acceleration Factor. Each column corresponds to a role in the Time Acceleration Factor relationship. The column “Time Acceleration Factor” is the response, and it is a formula column. The other three columns are input factors. The data table has two rows of data for establishing the initial ranges of the profiler. The profiler plots Time Acceleration Factor against Activation Energy, Baseline Degrees C, and Degrees C. In order to get the profiler, please run the script, by right clicking on the script and selecting “Run Script”; see following screen shot. Following screenshot shows the profiler after running the script. The third cell draws the relationship of Time Acceleration Factor against Degrees C, given certain Activation Energy and Baseline Degrees C. Click and move mouse in that cell to read off corresponding numbers of Time Acceleration Factor and Degrees C. To change Activation Energy or Baseline Degrees C, please either click and move mouse in the first and second cell or change the axis value directly. In order to find appropriate experiment temperature corresponding to a desired acceleration factor value, please give the value in the box of TargetFactorValue, then click “Update” button. The profiler will then find the temperature. Following screenshot is obtained after inputting 40 in the box and updating the profiler.


