Proposed State Forest Health Highlights Format
advertisement
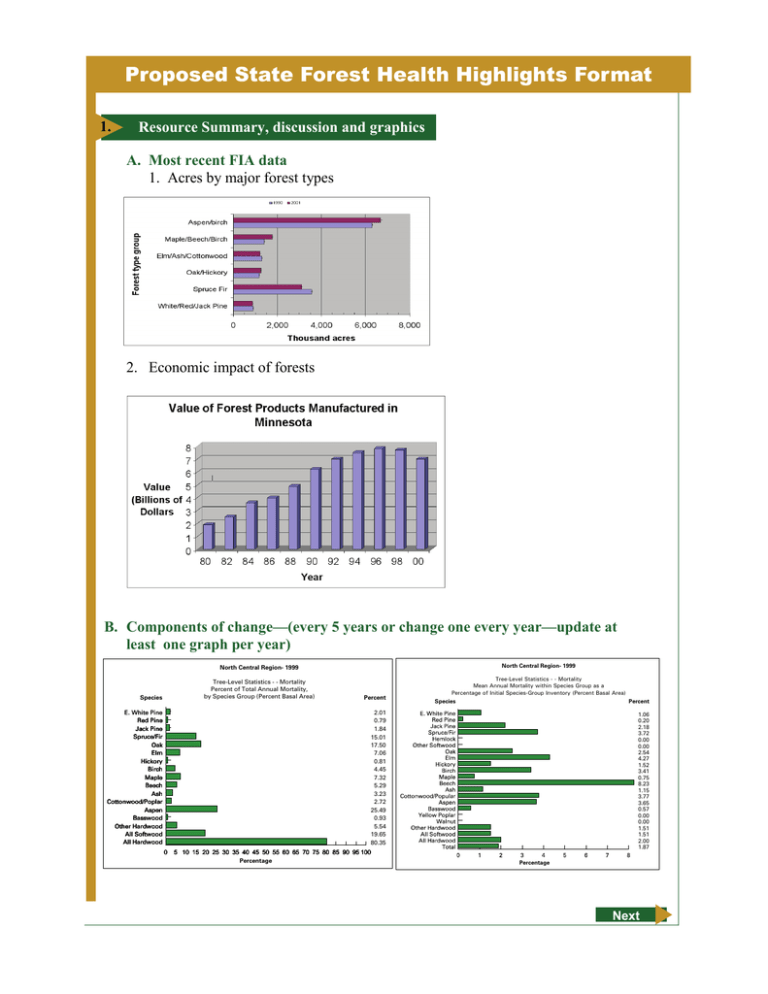
Proposed State Forest Health Highlights Format 1. Resource Summary, discussion and graphics A. Most recent FIA data 1. Acres by major forest types 2. Economic impact of forests B. Components of change—(every 5 years or change one every year—update at least one graph per year) North Central Region- 1999 North Central Region- 1999 Tree-Level Statistics - - Mortality Percent of Total Annual Mortality, by Species Group (Percent Basal Area) Species E. White Pine Red Pine Jack Pine Spruce/Fir Oak Elm Hickory Birch Maple Beech Ash Cottonwood/Poplar Aspen Basswood Other Hardwood All Softwood All Hardwood Percent Tree-Level Statistics - - Mortality Mean Annual Mortality within Species Group as a Percentage of Initial Species-Group Inventory (Percent Basal Area) Species Percent 2.01 0.79 1.84 15.01 17.50 7.06 0.81 4.45 7.32 5.29 3.23 2.72 25.49 0.93 5.54 19.65 80.35 0 5 10 15 20 25 30 35 40 45 50 55 60 65 70 75 80 85 90 95 100 Percentage 1.06 0.20 2.18 3.72 0.00 0.00 2.54 4.27 1.52 3.41 0.75 8.23 1.15 3.77 3.65 0.57 0.00 0.00 1.51 1.51 2.00 1.87 Percentage Next Page 2 B. Components of change—(every 5 years or change one every year—update at least one graph per year) continued... Cause North Central Region - 1999 North Central Region- 1999 Tree-Level Statistics - - Mortality Percent of Total Annual Mortality, by Cause of Death (Percent Basal Area) Tree-Level Statistics - - Removal Percent of Total Annual Removals, by Species Group (Percent Basal Area) 1.00 9.37 39.55 31.36 2.50 9.43 6.78 Insects Disease Weather Suppression Logging Unkown Other 0 Species Percent 2 4 6 8 10 12 14 16 18 20 22 24 26 28 30 32 34 36 38 40 Percentage Percent 0.84 3.36 2.06 0.52 34.88 1.93 16.09 4.30 0.79 21.58 13.66 6.79 93.22 Percentage North Central Region- 1999 Tree-Level Statistics - - Removals Mean Annual Removal within Species Group as a Percentage of Initial Species-Group Inventory (Percent Basal Area) Species Percent 0.18 0.34 0.00 0.22 0.00 0.07 1.52 0.46 0.00 4.17 0.16 0.00 0.00 0.36 1.09 0.00 0.00 0.00 1.34 0.21 0.90 0.73 Percentage Initial Inventory (Ba/ Ac) Gross Growth (Ba/Ac/ Yr) Mortality (Ba/Ac/ Yr) Removals (Ba/ Ac/Yr) Net Change (Ba/Ac/ Yr) Terminal Inventory (Ba/Ac/Yr) 3 4.36 72.27 2.68 1.63 0.00 1.04 79.73 Red Pine 10 2.70 144.29 3.83 1.63 0.37 1.83 149.09 White Pine 2 3.07 67.79 3.72 0.48 0.00 3.24 77.74 Balsam Fir 3 4.83 71.05 4.07 0.48 0.00 3.60 88.72 No. White Cedar 4 2.05 131.22 5.03 1.84 0.11 3.08 136.70 Other Spruce-Fir 10 3.40 66.23 1.20 0.53 0.00 0.67 68.64 5 3.74 97.35 1.91 3.87 3.63 -5.59 80.88 23 2.80 94.83 2.72 2.38 1.21 -0.87 92.52 1 2.05 92.44 1.58 0.58 0.00 1.01 94.50 Elm/Ash/Red Maple 11 2.38 76.33 3.02 1.39 0.33 1.30 79.68 Maple/Beech/ Birch 28 3.27 100.24 3.56 1.62 0.01 1.93 106.54 Aspen/Birch 19 3.36 66.50 3.93 1.36 1.41 1.17 69.59 3 2.32 84.49 2.68 1.52 3.44 -1.92 70.52 114 3.09 91.32 3.17 1.71 0.67 0.79 93.68 Oak/Pine Oak/Hickory Oak/Gum/ Cypress Other All Types Previous Next North Central Region- 1999 Jack Pine 1999 North Central - Components of Change Per-Acre-Level Statistics Means of Basic Components of Change by Initial Forest Type Forest Type Cycle Length n (Years) Page 3 2. Forest Health Issues A. Exotic or novel pest introduction/ outbreak, i.e. Sudden Oak Death, Emerald Ash Borer, Asian Longhorned Beetle. 3. B. Ongoing efforts with major pests, i.e. Gypsy Moth and other established exotic and native pests, oak wilt etc. Off-plot Survey Results A. Mortality and defoliation maps. Fourth year of outbreak Forest tent caterpillar 7.4 million acres defoliated. Forty ninth consecutive year of detectable defoliation. Spruce budworm 91,000 acres defoliated. Previous Next Page 4 4. P-3 Indicator Summary A. Ozone 0- 60 0 0 0 90 100 70 80 13 12 11 — — 0— — — 8 60 70 90 0— 10— 20 1 1 10 Thousands 5 0— 6— 7 9 15 13 17 11 — — — 7— 9— 13 11 15 N MN Ozone Injury Plots MN Ozone Injury Plots B. Soils Previous Next Page 5 D. DWM 1) One or both components of fuels. 2) Total tonnage. Mean tonnage/acre estimates and associated standard errors for coarse woody debris, fine woody debris, and duff/litter of the north central states 20 Course Wood Tons/acre 15 Fine Wood Duff/Litter 10 5 0 IL IN IA KS MI MN MO NE ND SD WI State E. Number of trees by species—(vegetation diversity) 11,230,174,596 Total All Species Quaking Aspen Black Spruce Balsam Fir Paper Birch Black Ash Tamarack (native) Red Maple Northern White-Cedar Balsam Poplar 30 7,5 71 ,71 2 63 5,8 85 ,87 5 964 ,20 0,0 38 1,2 92 ,5 1 4,2 01 1,6 20 ,82 8, 3 64 1,9 49 ,14 2,5 28 2,2 77 ,45 6,6 91 2,6 05 ,77 0,8 54 2,9 34 ,08 5,0 17 3,2 62 ,39 9,1 80 3,5 90 ,71 3,3 44 Sugar Maple Number of Species Previous Next
