Document 10779950
advertisement
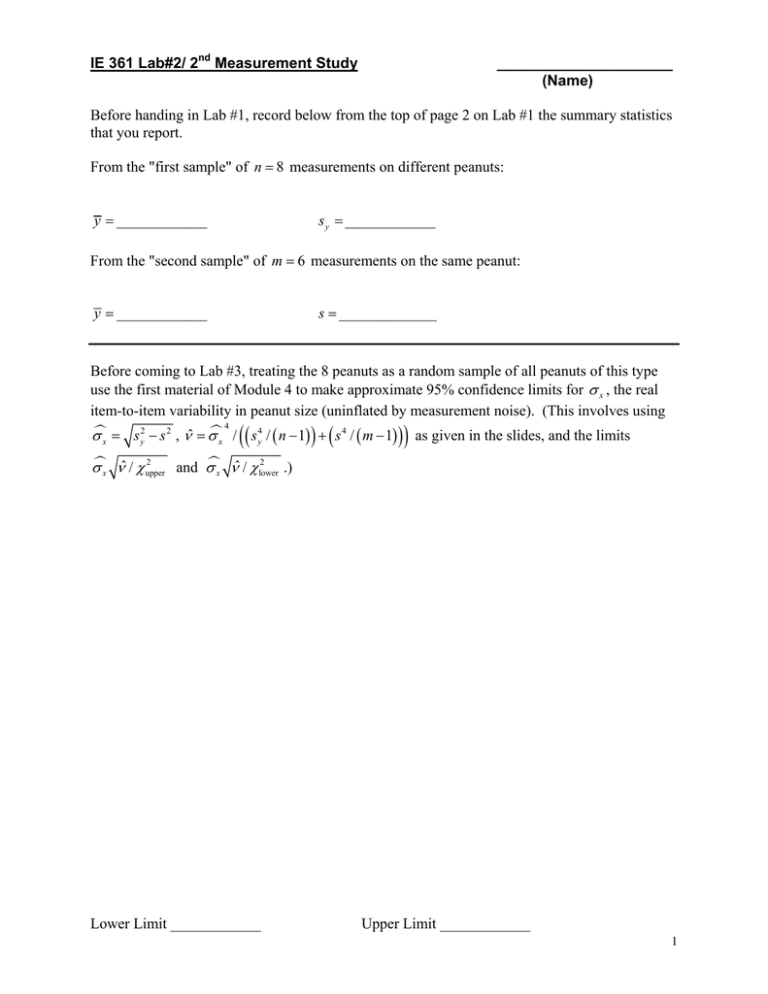
IE 361 Lab#2/ 2nd Measurement Study _____________________ (Name) Before handing in Lab #1, record below from the top of page 2 on Lab #1 the summary statistics that you report. From the "first sample" of n 8 measurements on different peanuts: y ____________ s y ____________ From the "second sample" of m 6 measurements on the same peanut: y ____________ s _____________ Before coming to Lab #3, treating the 8 peanuts as a random sample of all peanuts of this type use the first material of Module 4 to make approximate 95% confidence limits for x , the real item-to-item variability in peanut size (uninflated by measurement noise). (This involves using 4 s 2 s 2 , ˆ / s 4 / n 1 s 4 / m 1 as given in the slides, and the limits x y x y 2 2 x ˆ / upper and x ˆ / lower .) Lower Limit ____________ Upper Limit ____________ 1 Organize yourselves into Tables of at least 4 people (we want multiple "operators" in this Lab and 2 or 3 is probably not adequate). In the measuring, before making each measurement, close the jaws of the caliper and reset the "zero" on the dial. Take one peanut from your bag. Measure it once, and let everyone at your table do the same. Repeat this 4 more times, so that this peanut gets measured 5 times by each person at the table. Record the measurements below and calculate the sample means and standard deviations. (Record measurements to 1/100th of an inch and the summary statistics to one additional decimal place.) First Peanut Student #1 Student #2 Student #3 Student #4 Student #5 Student #6 y1 y2 y3 y4 y5 y6 s1 s2 s3 s4 s5 s6 As a way of getting some feel for what a one-way ANOVA summarizes, do the following. Find the sample VARIANCE of all measurements in the table above. (Note that the units here are square inches!) Then multiply this by the number of measurements in the table 1 (the divisor used in the sample variance) to get the "total sum of squares" ( SSTot from Module 4). SSTot ____________ 2 Find the simple arithmetic average of the sample VARIANCES in the table on page 2. This is (for this case where sample sizes are all the same) the "error mean square" ( MSE ) from Module 4. Multiply this average sample variance by 5 1 the number of students and you have the "error sum of squares" ( SSE from Module 4). SSE ____________ The ANOVA "treatment sum of squares" is the difference between SSTot and SSE . (That is, SSTr SSTot SSE .) What is that number here? SSTr ____________ (You should also be able to get this number for this case where all sample sizes are the same by multiplying the sample variance of the student means in the table on page 2 by 5 the number of students 1 .) Before coming to Lab #3 run the JMP "Fit Model" procedure to obtain a one-way ANOVA table and verify that your numbers above agree with entries of that table. Staple a printout from that session to this Lab for turning in. (To get an ANOVA table to print out, at first do NOT designate "students" as "random effects.") Redo the JMP "Fit Model" procedure after switching "students" to be "random effects" and find 95% confidence limits for and for device . (You'll need to take square roots of limits that come on the printout. Also include THIS printout with what you turn in.) 95% limits for device (a "repeatability" standard deviation): 95% limits for (a "reproducibility" standard deviation): 3 Take a second peanut from the bag and repeat the data collection summarized at the top of page 2 of this lab for a second peanut. You can record the data in the table below: Second Peanut Student #1 Student #2 Student #3 Student #4 Student #5 Student #6 Now make the range-based single number estimates of repeatability , reproducibility , and R&R discussed on pages 20-26 of the text and in Module 5. You may summarize some of your calculations in the table below. Peanut #1 Peanut #2 Student #1 y11 Student #2 y12 Student #3 y13 Student #4 y14 Student #5 y15 Student #6 y16 R11 R12 R13 R14 R15 R16 y21 y22 y23 y24 y25 y26 R21 R22 R23 R24 R25 R26 ̂ repeatability ____________ ̂ reproducibility ____________ 1 2 ̂ R&R ___________ 4
