Persistent Step-Flow Growth of Strained Films on Vicinal Substrates Wei Hong,
advertisement
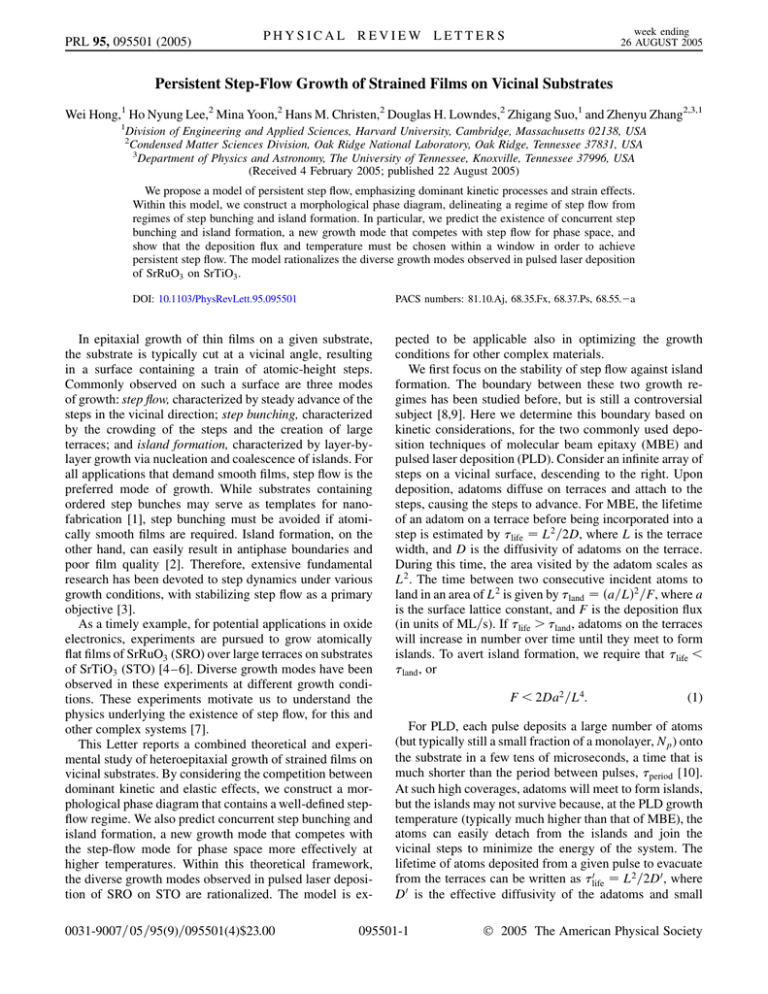
PRL 95, 095501 (2005) week ending 26 AUGUST 2005 PHYSICAL REVIEW LETTERS Persistent Step-Flow Growth of Strained Films on Vicinal Substrates Wei Hong,1 Ho Nyung Lee,2 Mina Yoon,2 Hans M. Christen,2 Douglas H. Lowndes,2 Zhigang Suo,1 and Zhenyu Zhang2,3,1 1 Division of Engineering and Applied Sciences, Harvard University, Cambridge, Massachusetts 02138, USA Condensed Matter Sciences Division, Oak Ridge National Laboratory, Oak Ridge, Tennessee 37831, USA 3 Department of Physics and Astronomy, The University of Tennessee, Knoxville, Tennessee 37996, USA (Received 4 February 2005; published 22 August 2005) 2 We propose a model of persistent step flow, emphasizing dominant kinetic processes and strain effects. Within this model, we construct a morphological phase diagram, delineating a regime of step flow from regimes of step bunching and island formation. In particular, we predict the existence of concurrent step bunching and island formation, a new growth mode that competes with step flow for phase space, and show that the deposition flux and temperature must be chosen within a window in order to achieve persistent step flow. The model rationalizes the diverse growth modes observed in pulsed laser deposition of SrRuO3 on SrTiO3 . DOI: 10.1103/PhysRevLett.95.095501 PACS numbers: 81.10.Aj, 68.35.Fx, 68.37.Ps, 68.55.2a In epitaxial growth of thin films on a given substrate, the substrate is typically cut at a vicinal angle, resulting in a surface containing a train of atomic-height steps. Commonly observed on such a surface are three modes of growth: step flow, characterized by steady advance of the steps in the vicinal direction; step bunching, characterized by the crowding of the steps and the creation of large terraces; and island formation, characterized by layer-bylayer growth via nucleation and coalescence of islands. For all applications that demand smooth films, step flow is the preferred mode of growth. While substrates containing ordered step bunches may serve as templates for nanofabrication [1], step bunching must be avoided if atomically smooth films are required. Island formation, on the other hand, can easily result in antiphase boundaries and poor film quality [2]. Therefore, extensive fundamental research has been devoted to step dynamics under various growth conditions, with stabilizing step flow as a primary objective [3]. As a timely example, for potential applications in oxide electronics, experiments are pursued to grow atomically flat films of SrRuO3 (SRO) over large terraces on substrates of SrTiO3 (STO) [4 –6]. Diverse growth modes have been observed in these experiments at different growth conditions. These experiments motivate us to understand the physics underlying the existence of step flow, for this and other complex systems [7]. This Letter reports a combined theoretical and experimental study of heteroepitaxial growth of strained films on vicinal substrates. By considering the competition between dominant kinetic and elastic effects, we construct a morphological phase diagram that contains a well-defined stepflow regime. We also predict concurrent step bunching and island formation, a new growth mode that competes with the step-flow mode for phase space more effectively at higher temperatures. Within this theoretical framework, the diverse growth modes observed in pulsed laser deposition of SRO on STO are rationalized. The model is ex0031-9007=05=95(9)=095501(4)$23.00 pected to be applicable also in optimizing the growth conditions for other complex materials. We first focus on the stability of step flow against island formation. The boundary between these two growth regimes has been studied before, but is still a controversial subject [8,9]. Here we determine this boundary based on kinetic considerations, for the two commonly used deposition techniques of molecular beam epitaxy (MBE) and pulsed laser deposition (PLD). Consider an infinite array of steps on a vicinal surface, descending to the right. Upon deposition, adatoms diffuse on terraces and attach to the steps, causing the steps to advance. For MBE, the lifetime of an adatom on a terrace before being incorporated into a step is estimated by life L2 =2D, where L is the terrace width, and D is the diffusivity of adatoms on the terrace. During this time, the area visited by the adatom scales as L2 . The time between two consecutive incident atoms to land in an area of L2 is given by land a=L2 =F, where a is the surface lattice constant, and F is the deposition flux (in units of ML=s). If life > land , adatoms on the terraces will increase in number over time until they meet to form islands. To avert island formation, we require that life < land , or F < 2Da2 =L4 : (1) For PLD, each pulse deposits a large number of atoms (but typically still a small fraction of a monolayer, Np ) onto the substrate in a few tens of microseconds, a time that is much shorter than the period between pulses, period [10]. At such high coverages, adatoms will meet to form islands, but the islands may not survive because, at the PLD growth temperature (typically much higher than that of MBE), the atoms can easily detach from the islands and join the vicinal steps to minimize the energy of the system. The lifetime of atoms deposited from a given pulse to evacuate from the terraces can be written as 0life L2 =2D0 , where D0 is the effective diffusivity of the adatoms and small 095501-1 2005 The American Physical Society PRL 95, 095501 (2005) clusters formed during a single deposition pulse; D0 may differ from the diffusivity of isolated adatoms, D, introduced earlier for MBE. For an average deposition flux F Np =period , to avert island formation, we require that 0life < period , or F < 2Np D0 =L2 : (2) We next focus on the stability of step flow against step bunching. Here we examine the competition between two known effects: an adatom attachment barrier at steps that stabilizes step flow [11], and an elastic interaction between steps that promotes step bunching [9,12 –14]. We assume that step meandering, if existing, has small amplitude so that the steps can be treated as straight and parallel line defects. In general, the coverage of adatoms on terraces, c, varies with time t and distance x in the vicinal direction. We adopt the quasi-steady-state approximation, @c=@t 0, justified as follows. The average velocity of a step is FL. Within the time L2 =D for adatoms to reach steady state, the step moves by FL3 =D, a distance that is much smaller than the terrace width L, according to Eqs. (1) and (2). This conclusion is reached by noting that a=L 1 in the case of MBE, and Np 1 in the case of PLD. Note that for PLD, cx should be taken as a distribution averaged over period , with D replaced by the effective diffusivity D0 . Consequently, on a terrace, away from the steps, we have D@2 c=@x2 F 0, leading to cx Fx2 =2D B1 x B0 . The two constants B1 and B0 are set by the rates of adatom attachment at the steps, as described in the following paragraphs. We now consider the energetic effect due to strain. At a distance larger than a few times the atomic size, the elastic field in the substrate induced by a step is equivalent to that by a combination of a force dipole and a force monopole [15]. Denote the position of step n at time t by xn t. The reduction in the elastic energy associated with step n moving per unit area is [16] fn 1 X m1 week ending 26 AUGUST 2005 PHYSICAL REVIEW LETTERS 1 2 : xnm xn xnm xn 3 (3) The first term describes the step-step attraction due to the force monopoles associated with the steps on a vicinal surface, with the constant being 1 2Y"2 h2 = 1 =1 , h is the step height, " is the misfit strain, Y is Young’s modulus, and is Poisson’s ratio. The second term describes the step-step repulsion due to the force dipoles, with the constant 2 depending on the magnitude of the force dipoles. When an adatom attaches to step n, the step advances by an area A, and the elastic energy of the system is reduced by Afn , which includes the contributions from all the steps. This energy reduction adds to the formation energy of adatoms on the terraces near step n. In equilibrium with this step, the coverage of adatoms is ceq xn c0 expAfn =kB T, where c0 is the equilibrium coverage in the absence of step-step interaction, kB is Boltzmann’s constant, and T is the temperature. Following Tersoff et al. [12], we neglect the interactions between adatoms and the steps [13,14]. To attach to a step, an adatom on a terrace may have to overcome an additional energy barrier, i.e., the EhrlichSchwoebel (ES) barrier [11]. Consequently, both the coverage on the upper terrace near the step, cx n , and the coverage on the lower terrace near the step, cx n , may differ from the equilibrium coverage ceq xn . As boundary conditions to determine B1 and B0 , the diffusion flux of adatoms on the terraces Ddc=dx at x equals n k cx c x , and the diffusion flux of adatoms on n eq n the terraces Ddc=dx at xn equals k cxn ceq xn , where k and k are the rate constants for the adatoms to attach to a given step from the upper and the lower terraces, respectively. The above procedure yields an explicit expression for the coverage distribution cx on every terrace. Once cx is determined, the steps move according to [11] dxn k cx n ceq xn k cxn ceq xn ; (4) dt giving the equation of motion of the steps: ln n1 Qn1 Fln1 k1 l2D Qn Fln k1 2D dxn ; ln 1 1 dt k1 k1 ln1 k k D D (5) where ln xn1 xn and Qn ceq xn1 ceq xn . When all the terraces are of the same width, L, the steps advance at the uniform velocity FL. To examine the stability of the uniform step flow, we perturb it with a Fourier component, such that the terrace p width is xn1 xn L qt expiKn, where i 1, q is the amplitude of the perturbation, and K is the wave number of the perturbation, restricted in the interval 0; 2. Linearizing (5) in terms of q, we obtain that dq=dt q, where 1 k1 2 1 cosK 1 Ac0 S k 2 1 iF sinK; F 1 1 L 2 1 L k TL B k k D k k D (6) with S K2 K1 2 =41 L2 K2 K. The amplitude of the perturbation evolves with time as qt q0 expt. Note that is, in general, a complex number: Re is the rate of decay or amplification of the perturbation, and Im the rate of oscillation of the perturbation. Step flow is stable if Re < 0 for all values of K. As evident from Eq. (6), step bunching is promoted by the step-step attraction due to the force monopoles (1 ), and by the attachment barrier for adatoms on the lower terrace (k ). Step flow is promoted by the step-step repulsion due to the force dipoles (2 ), and by the attachment barrier for adatoms on the upper terrace (k ). When the deposition 095501-2 PRL 95, 095501 (2005) PHYSICAL REVIEW LETTERS week ending 26 AUGUST 2005 flux is large enough, the kinetic effects prevail over the energetic effects. To proceed further, we make two simplifications. First, adatoms on the lower terrace typically attach to a step much faster than adatoms on the upper terrace, leading to k k (i.e., the standard ES-barrier effect). Second, the equilibrium separation between two steps isolated from p other steps, 2 =1 , is typically much smaller than the terrace width L; therefore, the repulsion in (3) is negligible for the dynamics of nearly equidistant steps. With these two simplifications, the step flow is stable against perturbations of all wave numbers if 2 1 Ac0 k Lk F> : (7) 1 D kB TL2 Figure 1 plots Eqs. (2) and (7) on the L; F plane at three growth temperatures for PLD, using system parameters suitable for SRO=STO. The lattice constants are aSTO 0:391 nm and aSRO 0:393 nm, giving the misfit strain " 0:006 [17]. We take Young’s modulus Y 1011 N=m2 and Poisson’s ratio 0:3. The estimated value for the elastic interaction parameter is 1 8 103 eV=nm. We also use expressions c0 expE0 =kB T, D D0 expED =kB T, and k D=a expEES =kB T, where the adatom formation energy is E0 0:9 eV, the ES barrier is EES 0:1 eV, the adatom diffusion barrier is ED 0:9 eV, and D0 2:3 1011 nm2 =s. The choices of these parameters will be justified later, when detailed comparison with experiments is made. Several important observations can be made from Fig. 1. (i) At each of the given growth temperatures, four growth regimes are identified: step flow, step bunching, island formation, and concurrent step bunching and island formation. (ii) With all other growth parameters fixed, step flow occurs only when F is within an interval, large enough to avert step bunching, and small enough to avert island formation. (iii) As T increases, the right-hand sides of both Eqs. (2) and (7) also increase, the latter faster than the former, leading to an expansion of the concurrent regime at the expense of the step-flow regime. (iv) Equation (7) scales as L2 for small terraces and as L1 for large terraces, while Eq. (2) always scales as L2 ; consequently, the two equations intersect at a certain terrace width, beyond which the step-flow regime ceases to exist. We next present experimental evidence that confirms various predictions of the model. The substrates were prepared by dipping as-received STO wafers in a buffered hydrofluoric acid for 30 s, followed by thermal annealing at 1100 –1200 C for 1 hr, yielding single-unit-cell stepped surfaces with TiO2 termination. SRO films were then grown by PLD using a KrF excimer laser (& 248 nm) at a substrate temperature of 700 C in 100 mTorr O2 . The average deposition flux is F 0:06 ML=s, with Np 0:006 ML and period 0:1 s. X-ray diffraction confirmed FIG. 1. Morphological phase diagrams plotted on the L; F plane at three growth temperatures. The solid data points marked by the solid circles correspond to the AFM images shown in Fig. 2 obtained by us, while the data points marked by the open circles correspond to the step-flow conditions reported in Ref. [4]. that the SRO films were fully strained to match the STO substrates [5]. Figure 2 shows atomic force microscopy (AFM) images of typical film morphologies after growing 10 nm of SRO on STO substrates of different average terrace widths. Step bunching occurs on substrates of small terraces A, step flow on intermediate terraces B–D, and island formation on large terraces E. This trend is consistent with the model prediction. When step flow occurred, the average terrace widths of the SRO films were unchanged from that of the STO substrates. 095501-3 PRL 95, 095501 (2005) PHYSICAL REVIEW LETTERS week ending 26 AUGUST 2005 FIG. 2 (color online). AFM images of SRO films grown at 700 C on STO substrates of different terrace widths. The white scale bars are 103 nm in width. regime of step flow from regimes of step bunching and island formation. We have shown the existence of a new growth mode, characterized by concurrent step bunching and island formation; this mode competes with step flow for phase space more effectively at higher temperatures. Furthermore, we stress that the deposition flux and temperature must be chosen within a window in order to achieve persistent step flow. The present model rationalizes the diverse growth modes observed in SRO=STO, and is expected to be applicable to heteroepitaxial growth of other complex materials as well. The model also offers an approach to extract intrinsic system parameters in future experiments. This work was supported in part by DOE Grant No. DEFG02-03ER46091, and by ORNL, managed by UTBattelle, LLC for the U.S. Department of Energy under DE-AC05-00OR22725. The data points A to E are marked in Fig. 1(b). For the boundary defined by Eq. (2) to go between the data points D and E, the effective adatom diffusivity must be in the range of D 4:8 106 1:1 107 nm2 =s. The range of the uncertainty is caused by the distance between the data points D and E. For the boundary defined by Eq. (7) to go between the data points A and B, we obtain 1:02 < E0 2EES < 1:15 eV. Here we have used the fact that, for the terrace widths studied in our experiments and for typical values of the ES barrier, the second term in Eq. (7) dominates, leading to the relation F const L1 exp E0 2EES =kB T. Given the F 1=L dependence, the uncertainty in (E0 2EES ) caused by the distance of the two data points A and B in Fig. 1(b) is very small, and comes mainly from the uncertainty in the effective adatom diffusivity. We also note that the available set of experimental data can determine only the resultant value of (E0 2EES ). Now we cross-check the values of the fitting parameters using independent experimental results [4]. Taking a typical value of the preexponential factor, D0 2:3 1011 nm2 =s, we obtain ED 0:83–0:90 eV, consistent with the experimentally determined range of ED 1:0 0:2 eV [4]. Also marked in Figs. 1(a) and 1(b) are different growth conditions for step flow obtained in Ref. [4]. We stress that all these data points fall into the proper regimes of the morphological phase diagrams, with no further adjustment of any of the fundamental parameters. Finally, we note that the set of parameters used earlier to plot Fig. 1 is consistent with the fitting results. In partitioning the resultant value of E0 2EES into E0 and EES , we have taken the commonly accepted view that the effective energy barrier against atom detachment from a step edge of transition metal oxides, ED E0 , is close to 2 eV. In summary, by considering the delicate interplay between kinetic processes and strain effects, we have constructed a morphological phase diagram, delineating a [1] M. Tsuchiya, P. M. Petroff, and L. A. Coldren, Appl. Phys. Lett. 54, 1690 (1989); P. Venezuela et al., Nature (London) 397, 678 (1999). [2] M. J. Bronikowski, Y. J. Wang, and R. J. Hamers, Phys. Rev. B 48, 12 361 (1993); J. Camarero, L. Spendeler, G. Schmidt, K. Heinz, J. J. Demiguel, and R. Miranda, Phys. Rev. Lett. 73, 2448 (1994). [3] C. S. Lent and P. I. Cohen, Surf. Sci. 139, 121 (1984); P. R. Pukite, C. S. Lent, and P. I. Cohen, Surf. Sci. 161, 39 (1985). [4] J. Choi et al., Appl. Phys. Lett. 79, 1447 (2001); G. Rijnders et al., Appl. Phys. Lett. 84, 505 (2004). [5] H. N. Lee et al., Appl. Phys. Lett. 84, 4107 (2004); Nature (London) 433, 395 (2005). [6] F. Sanchez et al., Appl. Phys. Lett. 85, 1981 (2004). [7] J. C. Bean et al., J. Vac. Sci. Technol. A 2, 436 (1984); M. Kawamura et al., Phys. Rev. Lett. 91, 096102 (2003). [8] J. H. Neave et al., Appl. Phys. Lett. 47, 100 (1985); Y. T. Lu and H. Metiu, Appl. Phys. Lett. 59, 3054 (1991); T. Sugimoto et al., Appl. Phys. Lett. 63, 2697 (1993); C. Roland and G. H. Gilmer, Phys. Rev. B 54, 2931 (1996). [9] C. Duport, P. Politi, and J. Villain, J. Phys. I 5, 1317 (1995). [10] D. H. Lowndes et al., Science 273, 898 (1996). [11] R. L. Schwoebel, J. Appl. Phys. 40, 614 (1969); G. Ehrlich and F. G. Hudda, J. Chem. Phys. 44, 1039 (1966); R. L. Schwoebel and E. J. Shipsey, J. Appl. Phys. 37, 3682 (1966). [12] J. Tersoff et al., Phys. Rev. Lett. 75, 2730 (1995). [13] C. Duport, P. Nozieres, and J. Villain, Phys. Rev. Lett. 74, 134 (1995). [14] Y. Xiang and W. N. E, Phys. Rev. B 69, 035409 (2004). [15] V. I. Marchenko and A. Ya. Parshin, Sov. Phys. JETP 52, 129 (1980); O. L. Alerhand et al., Phys. Rev. Lett. 61, 1973 (1988). [16] J. Tersoff, Phys. Rev. Lett. 74, 4962 (1995). [17] J. J. Randall and R. Ward, J. Am. Chem. Soc. 81, 2629 (1959). 095501-4


