FEATURES Page 1 of 1
advertisement
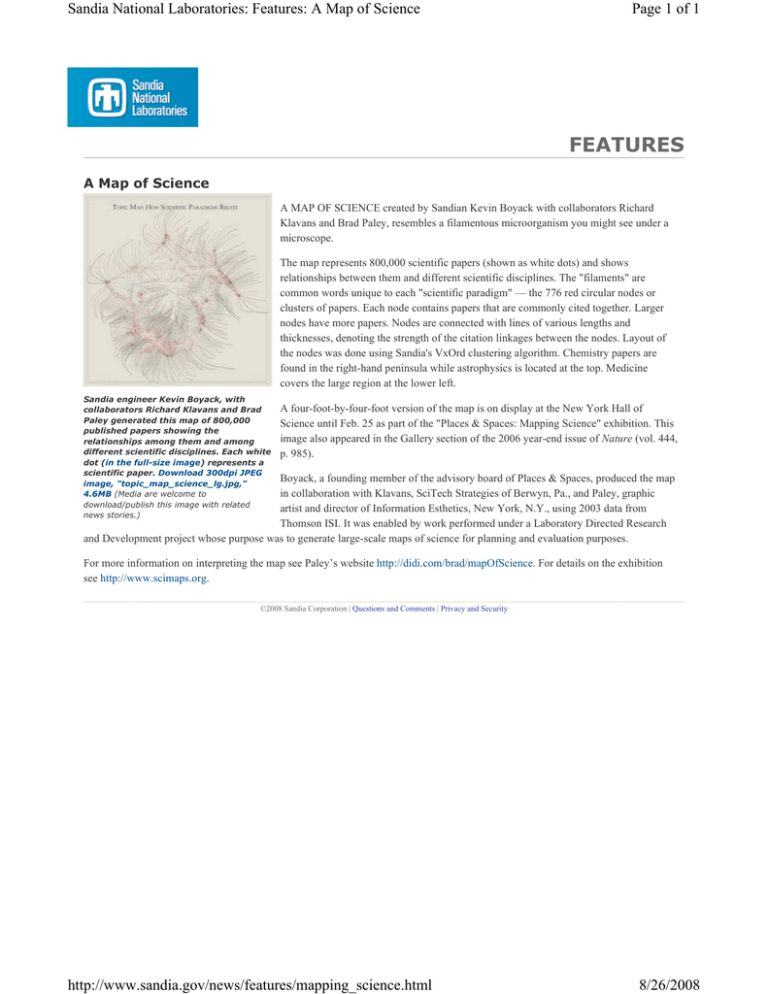
Sandia National Laboratories: Features: A Map of Science Page 1 of 1 FEATURES A Map of Science A MAP OF SCIENCE created by Sandian Kevin Boyack with collaborators Richard Klavans and Brad Paley, resembles a filamentous microorganism you might see under a microscope. The map represents 800,000 scientific papers (shown as white dots) and shows relationships between them and different scientific disciplines. The "filaments" are common words unique to each "scientific paradigm" — the 776 red circular nodes or clusters of papers. Each node contains papers that are commonly cited together. Larger nodes have more papers. Nodes are connected with lines of various lengths and thicknesses, denoting the strength of the citation linkages between the nodes. Layout of the nodes was done using Sandia's VxOrd clustering algorithm. Chemistry papers are found in the right-hand peninsula while astrophysics is located at the top. Medicine covers the large region at the lower left. Sandia engineer Kevin Boyack, with collaborators Richard Klavans and Brad Paley generated this map of 800,000 published papers showing the relationships among them and among different scientific disciplines. Each white dot (in the full-size image) represents a scientific paper. Download 300dpi JPEG image, "topic_map_science_lg.jpg," 4.6MB (Media are welcome to download/publish this image with related news stories.) A four-foot-by-four-foot version of the map is on display at the New York Hall of Science until Feb. 25 as part of the "Places & Spaces: Mapping Science" exhibition. This image also appeared in the Gallery section of the 2006 year-end issue of Nature (vol. 444, p. 985). Boyack, a founding member of the advisory board of Places & Spaces, produced the map in collaboration with Klavans, SciTech Strategies of Berwyn, Pa., and Paley, graphic artist and director of Information Esthetics, New York, N.Y., using 2003 data from Thomson ISI. It was enabled by work performed under a Laboratory Directed Research and Development project whose purpose was to generate large-scale maps of science for planning and evaluation purposes. For more information on interpreting the map see Paley’s website http://didi.com/brad/mapOfScience. For details on the exhibition see http://www.scimaps.org. ©2008 Sandia Corporation | Questions and Comments | Privacy and Security http://www.sandia.gov/news/features/mapping_science.html 8/26/2008
