Document 10765959
advertisement
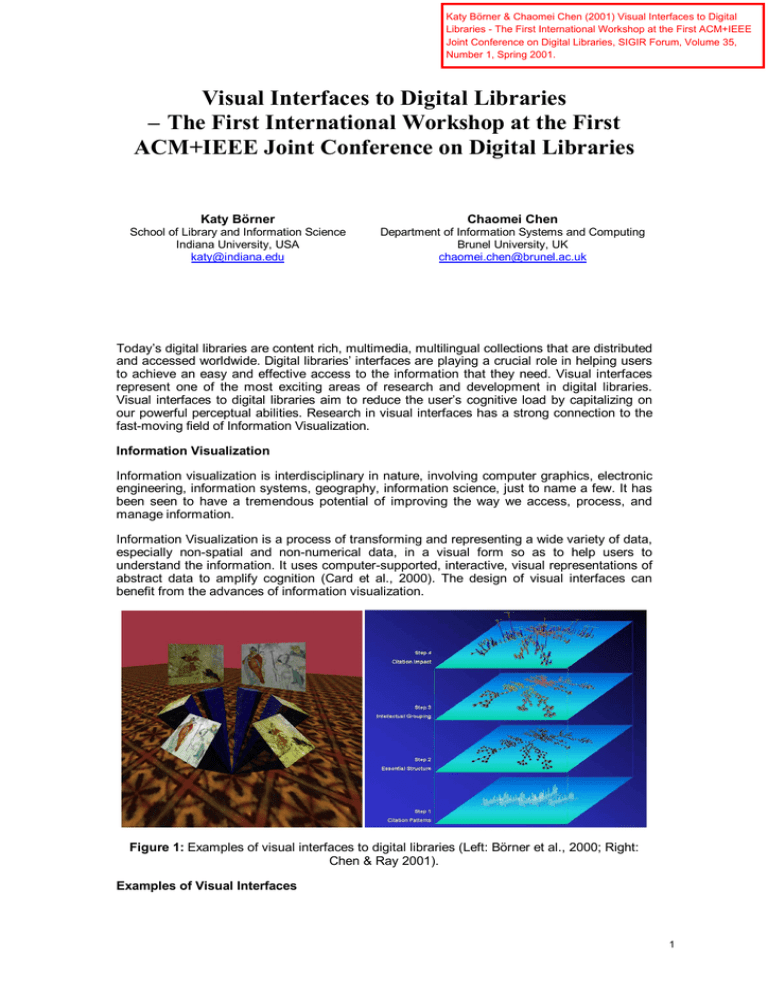
Katy Börner & Chaomei Chen (2001) Visual Interfaces to Digital Libraries - The First International Workshop at the First ACM+IEEE Joint Conference on Digital Libraries, SIGIR Forum, Volume 35, Number 1, Spring 2001. Visual Interfaces to Digital Libraries – The First International Workshop at the First ACM+IEEE Joint Conference on Digital Libraries Katy Börner Chaomei Chen School of Library and Information Science Indiana University, USA katy@indiana.edu Department of Information Systems and Computing Brunel University, UK chaomei.chen@brunel.ac.uk Today’s digital libraries are content rich, multimedia, multilingual collections that are distributed and accessed worldwide. Digital libraries’interfaces are playing a crucial role in helping users to achieve an easy and effective access to the information that they need. Visual interfaces represent one of the most exciting areas of research and development in digital libraries. Visual interfaces to digital libraries aim to reduce the user’s cognitive load by capitalizing on our powerful perceptual abilities. Research in visual interfaces has a strong connection to the fast-moving field of Information Visualization. Information Visualization Information visualization is interdisciplinary in nature, involving computer graphics, electronic engineering, information systems, geography, information science, just to name a few. It has been seen to have a tremendous potential of improving the way we access, process, and manage information. Information Visualization is a process of transforming and representing a wide variety of data, especially non-spatial and non-numerical data, in a visual form so as to help users to understand the information. It uses computer-supported, interactive, visual representations of abstract data to amplify cognition (Card et al., 2000). The design of visual interfaces can benefit from the advances of information visualization. Figure 1: Examples of visual interfaces to digital libraries (Left: Börner et al., 2000; Right: Chen & Ray 2001). Examples of Visual Interfaces 1 Figure 1 shows examples of visual interfaces from our own work. The LVis Digital Library Visualizer uses Latent Semantic Analysis (Landauer et al, 1998) to extract salient semantic structures and citation patterns automatically. Cluster techniques and a modified Boltzman algorithm are used to spatially visualize co-citation patterns and semantic similarity networks of retrieved documents for interactive exploration (Börner et al., 2000). Chen and Ray (2001) introduce an approach to visualizing a knowledge domain's intellectual structure by extending traditional author co-citation analysis (ACA). Citation patterns are extracted from the scientific literature and represented as a three-dimensional knowledge landscape. The integration of citation profiles and co-citation patterns within such knowledge landscapes provides an intellectual view of a knowledge domain. Domain visualizations help users to discover patterns, make valuable connections, and retrieval relevant works from the literature. Good Visualizations and Good Interfaces Good visualizations can help the design of visual interfaces in several ways, for example, by • reducing visual search time (e.g. by exploiting low level visual perception), • providing a better understanding of a complex data set (e.g., by exploiting data landscape metaphors), • revealing relations otherwise not being noticed (e.g., by exploiting the mind’s ability to see relationships in physical structures), • enabling to see a data set from several perspectives simultaneously, and • conveying information effectively . We believe that visual interfaces to digital libraries can assist • to provide rapid and efficient access to enormous amounts of multi-media knowledge and information, • to analyze document collections in new ways, • to leverage information (annotations, digital dog ears, footsteps) from previous users, and • to facilitate information sharing & collaborations. The First International Workshop The first international workshop on “Visual Interfaces to Digital Libraries" was held at the first ACM+IEEE Joint Conference on Digital Libraries in Roanoke, VA, USA on June 28th 2001. The one-day workshop draw an international audience of 37 researchers, practitioners, and graduate students from a range of disciplines, including information visualization, digital libraries, human-computer interaction, library and information science, computer science, and geography. Figure 2: Participants of the workshop. Photograph by Doug Pearson. 2 The workshop was successful in raising the awareness of several interconnected fields of research related to the design and use of visual interfaces to digital libraries, especially in information visualization, human-computer interaction, and cognitive psychology. The workshop started with Katy Börner’s introduction and overview, followed by an invited talk from Stephen Eick of Visual Insights, entitled “Visualizing On-line Activity”. Stephen explained how their eBizInsights provides a rich visual interactive workspace for analyzing users’access to a given website and discovering browsing patterns. In a self-introduction session, all participants enjoyed the opportunity to introduce themselves, especially on their interests and what they expected from the workshop. Eight papers were presented in two sessions. The topics ranged from literature visualization, spatial hypertext, to geographic information systems. 1. Buzydlowski et al.: Co-Cited Author Analysis as an Interface for Digital Libraries 2. Weiss-Lijn et al.: Supporting Document Use Through Interactive Visualization of Metadata 3. Buchanan et al.: Spatial Hypertext as a Reader Tool in Digital Libraries 4. Sullivan: Hilbert Problems in Visual Interface Development/Evaluation 5. Skupin: Cartographic Considerations for Map-like Interfaces to Digital Libraries 6. Cai: GeoVIBE: A Visual Interface to Geographic Digital Library 7. Boyack et al.: Information Visualization, Human Computer Interaction, and Cognitive Psychology: Domain Visualizations 8. Christel: Accessing News Video Libraries through Dynamic Information Extraction, Summarization, and Visualization Figure 3: Interactive demo’s on large screens. Many participants tasted VRCO's threedimensional virtual reality system - VGeo for the first time. Two interactive demonstration sessions included a demo of VRCO's VGeo system and demos from many WS attendees. An expert panel discussed the future of research and development and started formulating top-ten research challenges for visual interfaces to digital libraries to help focus and guide research. In his concluding remark, Chaomei Chen outlined promising areas for future information visualization research, namely, Visual Information Retrieval, Visual Information Exploration, Visual Information Organization, Accommodating Individual Differences, Supporting Collaborative Work, Information Visualization for Bibliometrics, Information Visualization for Scientometrics, Knowledge Tracking, Knowledge Discovery, Designing and Deploying Tangible and Meaningful VisualSpatial Metaphors in Digital Libraries. 3 Figure 4: A lively discussion between the audience and the expert panel. The Future The workshop has brought together people across disciplines. Many participants have expressed their increased interests in this multidisciplinary research. In response to the enthusiastic audience, the high-quality inputs, and many promising work in progress, we plan to hold the workshop again at the next JCDL Conference in Portland, Oregon, US, July 14-18, 2002. Papers, presentation slides, and other information are available from the workshop’s homepage http://vw.indiana.edu/visual01/. We would like to thank the JCDL organizing committee for their great support and Virtual Reality Software & Consulting for their sponsorship (http://www.vrco.com/). We would also like to thank the members of our program committee. References Katy Börner, Andrew Dillon & Margaret Dolinsky (2000) LVis - Digital Library Visualizer. Information Visualisation 2000, Symposium on Digital Libraries, London, England, 19 -21 July, pp. 77-81. Card, S. K., Mackinlay, J. D., and Schneiderman, B. (eds) (1999) Readings in Information Visualization. Morgan Kaufmann Publishers. Chen, C. & Paul, R. J. (March 2001) Visualizing a knowledge domain’s intellectual structure. Computer, 34(3), 65-71. Cruz-Neira, C., Sandin, D. J. and DeFanti, T. A. (1993) Surround-screen projection-based virtual reality: The design and implementation of the CAVE, in J. T. Kajiya (ed.), Computer Graphics (Proceedings of SIGGRAPH 93), Vol. 27, Springer Verlag, pp. 135-142. Landauer, T. K., Foltz, P. W., & Laham, D. (1998) Introduction to Latent Semantic Analysis. Discourse Processes, 25, 259-284. 4
