Cyberinfrastructure and Datasets for Science of Team Science Research
advertisement
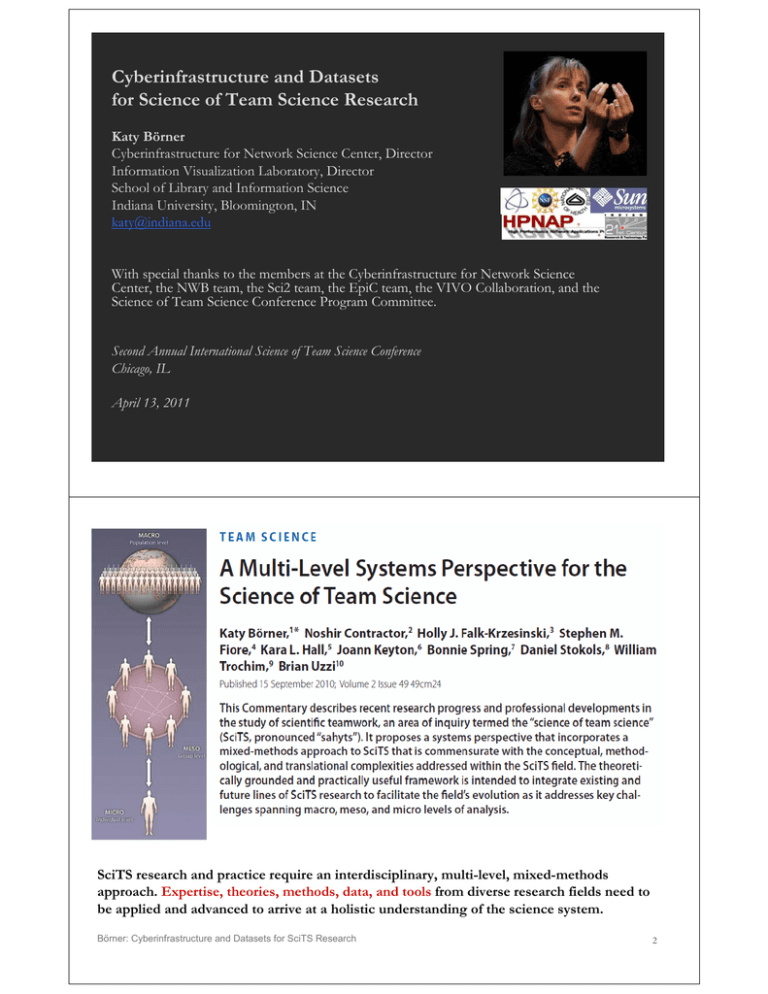
Cyberinfrastructure and Datasets for Science of Team Science Research Katy Börner Cyberinfrastructure for Network Science Center, Director Information Visualization Laboratory, Director School of Library and Information Science Indiana University, Bloomington, IN katy@indiana.edu With special thanks to the members at the Cyberinfrastructure for Network Science Center, the NWB team, the Sci2 team, the EpiC team, the VIVO Collaboration, and the Science of Team Science Conference Program Committee. Second Annual International Science of Team Science Conference Chicago, IL April 13, 2011 SciTS research and practice require an interdisciplinary, multi-level, mixed-methods approach. Expertise, theories, methods, data, and tools from diverse research fields need to be applied and advanced to arrive at a holistic understanding of the science system. Börner: Cyberinfrastructure and Datasets for SciTS Research 2 Mixed-methods, multi-level SciTS needs: Expertise – identify and access it at the perfect moment using, e.g., Facebook, LinkedIn, Academia, VIVO, Harvard Profiles, Elsevier’s Collexis, Loki, Stanford’s CAP, or other systems. Theories and Methods – find, understand, apply, advance them, e.g., using http://scienceofteamscience. northwestern. edu/team-science-resources. Data – find, interlink, unify, merge, reformat, share them, e.g., using web sites analogous to http://www.diggingintodata.org/ Repositories/tabid/167/Default.aspx, SDB, or LOD. Tools – identify, learn, advance, share code, e.g., via Plug-andPlay Macroscopes, to arrive at a holistic understanding of the science system. Note that the evolution of all of the above could be an extremely interesting and valuable SciTS study object. Börner: Cyberinfrastructure and Datasets for SciTS Research Expertise 3 – identify and access it at the perfect moment using, e.g., Facebook, LinkedIn, Academia, VIVO, Harvard Profiles, Elsevier’s Collexis, Loki, Stanford’s CAP, or other systems. Börner: Cyberinfrastructure and Datasets for SciTS Research 4 VIVO: A Semantic Approach to Creating a National Network of Researchers (http://vivoweb.org) • Semantic web application and ontology editor originally developed at Cornell U. • Integrates research and scholarship info from systems of record across institution(s). • Facilitates research discovery and crossdisciplinary collaboration. • Simplify reporting tasks, e.g., generate biosketch, department report. Funded by $12 million NIH award. Cornell University: Dean Krafft (Cornell PI), Manolo Bevia, Jim Blake, Nick Cappadona, Brian Caruso, Jon Corson-Rikert, Elly Cramer, Medha Devare, John Fereira, Brian Lowe, Stella Mitchell, Holly Mistlebauer, Anup Sawant, Christopher Westling, Rebecca Younes. University of Florida: Mike Conlon (VIVO and UF PI), Cecilia Botero, Kerry Britt, Erin Brooks, Amy Buhler, Ellie Bushhousen, Chris Case, Valrie Davis, Nita Ferree, Chris Haines, Rae Jesano, Margeaux Johnson, Sara Kreinest, Yang Li, Paula Markes, Sara Russell Gonzalez, Alexander Rockwell, Nancy Schaefer, Michele R. Tennant, George Hack, Chris Barnes, Narayan Raum, Brenda Stevens, Alicia Turner, Stephen Williams. Indiana University: Katy Borner (IU PI), William Barnett, Shanshan Chen, Ying Ding, Russell Duhon, Jon Dunn, Micah Linnemeier, Nianli Ma, Robert McDonald, Barbara Ann O'Leary, Mark Price, Yuyin Sun, Alan Walsh, Brian Wheeler, Angela Zoss. Ponce School of Medicine: Richard Noel (Ponce PI), Ricardo Espada, Damaris Torres. The Scripps Research Institute: Gerald Joyce (Scripps PI), Greg Dunlap, Catherine Dunn, Brant Kelley, Paula King, Angela Murrell, Barbara Noble, Cary Thomas, Michaeleen Trimarchi. Washington University, St. Louis: Rakesh Nagarajan (WUSTL PI), Kristi L. Holmes, Sunita B. Koul, Leslie D. McIntosh. Weill Cornell Medical College: Curtis Cole (Weill PI), Paul Albert, Victor Brodsky, Adam Cheriff, Oscar Cruz, Dan Dickinson, Chris Huang, Itay Klaz, Peter Michelini, Grace Migliorisi, John Ruffing, Jason Specland, Tru Tran, Jesse Turner, Vinay Varughese. Type of Analysis vs. Level of Analysis Micro/Individual (1-100 records) Meso/Local (101–10,000 records) Macro/Global (10,000 < records) Statistical Analysis/Profiling Individual person and their expertise profiles Larger labs, centers, universities, research domains, or states All of NSF, all of USA, all of science. Temporal Analysis (When) Funding portfolio of one individual Mapping topic bursts in 20-years of PNAS 113 Years of Physics Research Geospatial Analysis (Where) Career trajectory of one individual Mapping a states intellectual landscape PNAS publications Topical Analysis (What) Base knowledge from which one grant draws. Knowledge flows in Chemistry research VxOrd/Topic maps of NIH funding Network Analysis (With Whom?) NSF Co-PI network of one individual Co-author network NIH’s core competency 8 Temporal Analysis (When) Temporal visualizations of the number of papers/funding award at the institution, school, department, and people level 9 Topical Analysis (What) Science map overlays will show where a person, department, or university publishes most in the world of science. (soon) 10 Network Analysis (With Whom?) Who is co-authoring, co-investigating, co-inventing with whom? What teams are most productive in what projects? 11 02/2010 Science is global. World view of VIVO activity. Web site visits are aggregated at the country level. Geospatial Analysis (Where) Where is what science performed by whom? Science is global and needs to be studied globally. (in work) 12 04/2010 Shown are the - Number of people profiles in the 7 different VIVO installation sites plus CAS and U Melbourne. - Email contacts by data and service providers as well as institutions interested to adopt VIVO. - The number of visitors on http://vivoweb.org Circles are area size coded using a logarithmic scale. 13 06/2010 VIVO 1.0 source code was publicly released on April 14, 2010 87 downloads by June 11, 2010. The more institutions adopt VIVO, the more high quality data will be available to understand, navigate, manage, utilize, and communicate progress in science and technology. 14 http://vivo-netsci.cns.iu.edu 15 Theories and Methods – find, understand, apply, advance them. Börner: Cyberinfrastructure and Datasets for SciTS Research 16 Also available are listings of • Upcoming conference and workshops: • Past Conferences and Workshops: • Selected References: • Team Science Training: • Team Science Tools: • Interdisciplinary Research and Team Science Resources: • Professional Organizations: • Team Science Blog and Twitter: • Science of Team Science Publishing Venues: http://scienceofteamscience.northwestern.edu/team-science-resources 17 Facilitates information and knowledge exchange, via a wiki-based platform Users can freely upload/download publicly available team science resources Will help reduce replication of resources, accelerate advances in the field www.teamsciencetoolkit.cancer.gov 18 http://hubzero.org 19 http://hubzero.org 20 Data – find, access, interlink, unify, merge, reformat, share them, e.g., using web sites analogous to http://www.diggingintodata.org/Repositories/ tabid/167/Default.aspx, SDB, or LOD. Börner: Cyberinfrastructure and Datasets for SciTS Research http://www.diggingintodata.org/Repositories/tabid/167/Default.aspx 21 Scholarly Database at Indiana University http://sdb.wiki.cns.iu.edu Supports federated search of 25 million publication, patent, grant records. Results can be downloaded as data dump and (evolving) co-author, paper-citation networks. Register for free access at http://sdb.cns.iu.edu 23 Since March 2009: Users can download networks: - Co-author - Co-investigator - Co-inventor - Patent citation and tables for burst analysis in NWB. Semantic Web: Linked Open Data Interlinking existing data silos and Exposing them as structured data Adding new high quality data relevant for S&T studies http://linkeddata.org Save Data.gov, sign the petition at http://om.ly/BRPRE Twitter #savethedata August 2007 Börner: Cyberinfrastructure and Datasets for SciTS Research 26 http://www4.wiwiss.fu-berlin.de/bizer/pub/lod-datasets_2009-03-05_colored.png 27 28 http://vivoexperts.ctsi.ufl.edu Tools – continuously identify, learn, advance, share code, e.g., via Plug-and-Play Macroscopes Börner: Cyberinfrastructure and Datasets for SciTS Research 30 Börner, Katy. (March 2011). Plug-and-Play Macroscopes. Communications of the ACM, 54(3), 60-69. Video and paper are at http://www.scivee.tv/node/27704 31 Designing “Dream Tools” Many of the best micro-, tele-, and macroscopes are designed by scientists keen to observe and comprehend what no one has seen or understood before. Galileo Galilei (1564–1642) recognized the potential of a spyglass for the study of the heavens, ground and polished his own lenses, and used the improved optical instruments to make discoveries like the moons of Jupiter, providing quantitative evidence for the Copernican theory. Today, scientists repurpose, extend, and invent new hardware and software to “macroscopes” that may solve both local and create global challenges. empower me, my students, colleagues, and Plug-and-play macroscopes 100,000 others that downloaded them. 32 Macroscopes Decision making in science, industry, and politics, as well as in daily life, requires that we make sense of data sets representing the structure and dynamics of complex systems. Analysis, navigation, and management of these continuously evolving data sets require a new kind of data-analysis and visualization tool we call a macroscope (from the Greek macros, or “great,” and skopein, or “to observe”) inspired by de Rosnay’s futurist science writings. Macroscopes provide a “vision of the whole,” helping us “synthesize” the related elements and enabling us to detect patterns, trends, and outliers while granting access to myriad details. Rather than make things larger or smaller, macroscopes let us observe what is at once too great, slow, or complex for the human eye and mind to notice and comprehend. Microscopes Telescopes Macroscopes 33 Macroscopes cont. While microscopes and telescopes are physical instruments, macroscopes resemble continuously changing bundles of software plug-ins. Macroscopes make it easy to select and combine algorithm and tool plug-ins but also interface plug-ins, workflow support, logging, scheduling, and other plug-ins needed for scientifically rigorous yet effective work. They make it easy to share plug-ins via email, flash drives, or online. To use new plugins, simply copy the files into the plug-in directory, and they appear in the tool menu ready for use. No restart of the tool is necessary. Sharing algorithm components, tools, or novel interfaces becomes as easy as sharing images on Flickr or videos on YouTube. Assembling custom tools is as quick as compiling your custom music collection. 34 Macroscopes Serve the Changing Scientific Landscape Different datasets/formats. Diverse algorithms/tools written in many programming languages. Physics IS CS SNA Bio 35 Changing Scientific Landscape—General Observations Science becomes more data driven and computational but also collaborative and interdisciplinary. There is increased demand for tools that are easy to extend, share, and customize: Star scientist —> Research teams. Traditionally, science was driven by key scientists. Today, science is driven by collaborating co-author teams, often comprising experts from multiple disciplines and geospatial locations. Users —> Contributors. Web 2.0 technologies empower users to contribute to Wikipedia and exchange images, videos, and code via Fickr, YouTube, and SourceForge.net. Disciplinary —> Cross-disciplinary. The best tools frequently borrow and synergistically combine methods and techniques from different disciplines of science, empowering interdisciplinary and/or international teams to collectively fine-tune and interpret results; Single specimen —> Data streams. Microscopes and telescopes were originally used to study a single specimen at a time. Today, many researchers must make sense of massive data streams comprising multiple data types and formats from different origins; and Static instrument —> Evolving cyberinfrastructure. The importance of hardware instruments that are static and expensive tends to decrease relative to software tools and services that are highly flexible and evolving to meet the needs of different sciences. Some of the most successful tools and services are decentralized, increasing scalability and fault tolerance. 36 Related Work Google Code and SourceForge.net provide special means for developing and distributing software In August 2009, SourceForge.net hosted more than 230,000 software projects by two million registered users (285,957 in January 2011); In August 2009 ProgrammableWeb.com hosted 1,366 application programming interfaces (APIs) and 4,092 mashups (2,699 APIs and 5,493 mashups in January 2011) Cyberinfrastructures serving large biomedical communities Cancer Biomedical Informatics Grid (caBIG) (http://cabig.nci.nih.gov) Biomedical Informatics Research Network (BIRN) (http://nbirn.net) Informatics for Integrating Biology and the Bedside (i2b2) (https://www.i2b2.org) HUBzero (http://hubzero.org) platform for scientific collaboration uses myExperiment (http://myexperiment.org) supports the sharing of scientific workflows and other research objects. Missing so far is a common standard for the design of modular, compatible algorithm and tool plug-ins (also called “modules” or “components”) that can be easily combined into scientific workflows (“pipeline” or “composition”), and packaged as custom tools. 37 OSGi & CIShell CIShell (http://cishell.org) is an open source software specification for the integration and utilization of datasets, algorithms, and tools. It extends the Open Services Gateway Initiative (OSGi) (http://osgi.org), a standardized, component oriented, computing environment for networked services widely used in industry since more than 10 years. Specifically, CIShell provides “sockets” into which existing and new datasets, algorithms, and tools can be plugged using a wizard-driven process. Developers Workflow Alg Alg Users CIShell Wizards Alg CIShell Sci2 Tool Workflow NWB Tool Tool Tool Workflow Workflow 38 CIShell Developer Guide (http://cishell.wiki.cns.iu.edu) Tools Workshop on “Social Network Analysis” Thursday, April 14 • 1:15 – 5:00 PM This workshop presents and demonstrates CIShell-powered tools such as the Network Workbench (NWB) Tool (http://nwbcns.iu.edu) and the Science of Science (Sci2) Tool (http://sci2.cns.iu.edu).The NWB Tools is a network analysis, modeling, and visualization toolkit for physics, biomedical, and social science research. The Sci2 Tool was specifically designed for researchers and science policy makers interested to study and understand the structure and dynamics of science. Both tools are standalone desktop applications that install and run on Windows, Linux x86 and Mac OSX. The tools provide easy access to more than 160 algorithms for the study of temporal, geospatial, topical, and network datasets at the micro (individual), meso (local), and macro (global) levels. 39 CIShell Portal (http://cishell.org) 40 Network Workbench Tool http://nwb.slis.indiana.edu The Network Workbench (NWB) tool supports researchers, educators, and practitioners interested in the study of biomedical, social and behavioral science, physics, and other networks. In February 2009, the tool provides more 169 plugins that support the preprocessing, analysis, modeling, and visualization of networks. More than 50 of these plugins can be applied or were specifically designed for S&T studies. It has been downloaded more than 65,000 times since December 2006. Herr II, Bruce W., Huang, Weixia (Bonnie), Penumarthy, Shashikant & Börner, Katy. (2007). Designing Highly Flexible and Usable Cyberinfrastructures for Convergence. In Bainbridge, William S. & Roco, Mihail C. (Eds.), Progress in Convergence - Technologies for Human Wellbeing (Vol. 1093, pp. 161-179), Annals of the New York Academy of Sciences, Boston, MA. 41 http://sci2.cns.iu.edu http://sci2.wiki.cns.iu.edu 42 Sci2 Tool – “Open Code for S&T Assessment” OSGi/CIShell powered tool with NWB plugins and many new scientometrics and visualizations plugins. Sci Maps GUESS Network Vis Horizontal Time Graphs Börner, Katy, Huang, Weixia (Bonnie), Linnemeier, Micah, Duhon, Russell Jackson, Phillips, Patrick, Ma, Nianli, Zoss, Angela, Guo, Hanning & Price, Mark. (2009). Rete-Netzwerk-Red: Analyzing and Visualizing Scholarly Networks Using the Scholarly Database and the Network Workbench Tool. Proceedings of ISSI 2009: 12th International Conference on Scientometrics and Informetrics, Rio de Janeiro, Brazil, July 14-17 . Vol. 2, pp. 619-630. Sci2 Tool Geo Maps Circular Hierarchy OSGi/CIShell Adoption A number of other projects recently adopted OSGi and/or CIShell: Cytoscape (http://cytoscape.org) Led by Trey Ideker at the University of California, San Diegois an open source bioinformatics software platform for visualizing molecular interaction networks and integrating these interactions with gene expression profiles and other state data (Shannon et al., 2002). Taverna Workbench (http://taverna.org.uk) Developed by the myGrid team (http://mygrid.org.uk) led by Carol Goble at the University of Manchester, U.K. is a free software tool for designing and executing workflows (Hull et al., 2006). Taverna allows users to integrate many different software tools, including over 30,000 web services. MAEviz (https://wiki.ncsa.uiuc.edu/display/MAE/Home) Managed by Jong Lee at NCSA is an open-source, extensible software platform which supports seismic risk assessment based on the Mid-America Earthquake (MAE) Center research. TEXTrend (http://textrend.org) Led by George Kampis at Eötvös Loránd University, Budapest, Hungary supports natural language processing (NLP), classification/mining, and graph algorithms for the analysis of business and governmental text corpuses with an inherently temporal component. DynaNets (http://www.dynanets.org) Coordinated by Peter M.A. Sloot at the University of Amsterdam, The Netherlands develops algorithms to study evolving networks. As the functionality of OSGi-based software frameworks improves and the number and diversity of dataset and algorithm plugins increases, the capabilities of custom tools will expand. Embrace the Changing Scientific Landscape Common algorithm/tool pool Easy way to share new algorithms Workflow design logs Custom tools TexTrend EpiC Converters NWB Sci2 IS CS Bio SNA Phys 46 Mixed-methods, multi-level SciTS needs: Expertise – identify and access it at the perfect moment using, e.g., Facebook, LinkedIn, Academia, VIVO, Harvard Profiles, Elsevier’s Collexis, Loki, Stanford’s CAP, or other systems. Theories and Methods – find, understand, apply, advance them, e.g., using http://scienceofteamscience. northwestern. edu/team-science-resources. Data – find, interlink, unify, merge, reformat, share them, e.g., using web sites analogous to http://www.diggingintodata.org/ Repositories/tabid/167/Default.aspx, SDB, or LOD. Tools – identify, learn, advance, share code, e.g., via Plug-andPlay Macroscopes, to arrive at a holistic understanding of the science system. Note that the evolution of all of the above could be an extremely interesting and valuable SciTS study object. Börner: Cyberinfrastructure and Datasets for SciTS Research Exp Theories & Methods 47 Data Tools Different levels and types of analysis will require access to very different Expertise, Theories and Methods, Data, and Tools. 48 Exp Theories & Methods Data Tools Ideally, a future SciTS CI can provide easy access to the best, highest quality Expertise, Theories and Methods, Data, and Tools. 49 Exp Theories & Methods Data Tools So that researchers, practitioners, and students can fully benefit and advance Expertise, Theories and Methods, Data, and Tools. 50 References Börner, Katy, Chen, Chaomei, and Boyack, Kevin. (2003). Visualizing Knowledge Domains. In Blaise Cronin (Ed.), ARIST, Medford, NJ: Information Today, Volume 37, Chapter 5, pp. 179-255. http://ivl.slis.indiana.edu/km/pub/2003-borner-arist.pdf Shiffrin, Richard M. and Börner, Katy (Eds.) (2004). Mapping Knowledge Domains. Proceedings of the National Academy of Sciences of the United States of America, 101(Suppl_1). http://www.pnas.org/content/vol101/suppl_1/ Börner, Katy, Sanyal, Soma and Vespignani, Alessandro (2007). Network Science. In Blaise Cronin (Ed.), ARIST, Information Today, Inc., Volume 41, Chapter 12, pp. 537607. http://ivl.slis.indiana.edu/km/pub/2007-borner-arist.pdf Börner, Katy (2010) Atlas of Science. MIT Press. http://scimaps.org/atlas Scharnhorst, Andrea, Börner, Katy, van den Besselaar, Peter (2011) Models of Science Dynamics. Springer Verlag. 51 All papers, maps, tools, talks, press are linked from http://cns.iu.edu CNS Facebook: http://www.facebook.com/pages/Cyberinfrastructure-forNetwork-Science-Center/144339535612571 Maping Science Exhibit Facebook: http://www.facebook.com/mappingscience
