International, Interdisciplinary Plug-and-Play Macroscopes
advertisement
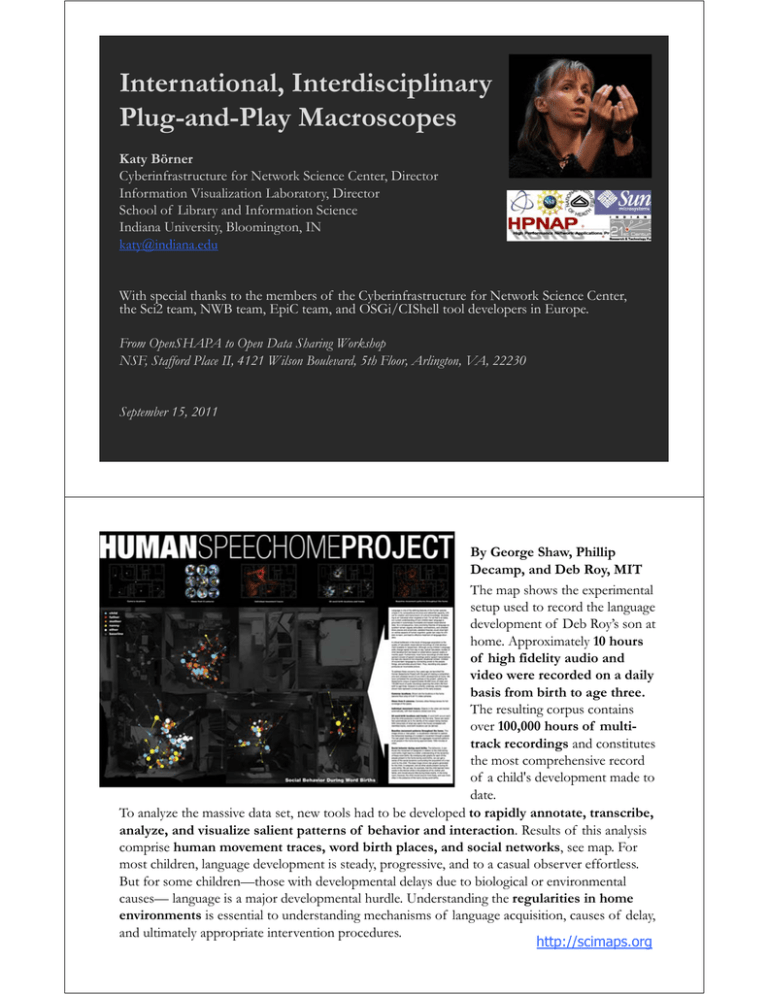
International, Interdisciplinary Plug-and-Play Macroscopes Katy Börner Cyberinfrastructure for Network Science Center, Director Information Visualization Laboratory, Director School of Library and Information Science Indiana University, Bloomington, IN katy@indiana.edu With special thanks to the members of the Cyberinfrastructure for Network Science Center, the Sci2 team, NWB team, EpiC team, and OSGi/CIShell tool developers in Europe. From OpenSHAPA to Open Data Sharing Workshop NSF, Stafford Place II, 4121 Wilson Boulevard, 5th Floor, Arlington, VA, 22230 September 15, 2011 By George Shaw, Phillip Decamp, and Deb Roy, MIT The map shows the experimental setup used to record the language development of Deb Roy’s son at home. Approximately 10 hours of high fidelity audio and video were recorded on a daily basis from birth to age three. The resulting corpus contains over 100,000 hours of multitrack recordings and constitutes the most comprehensive record of a child's development made to date. To analyze the massive data set, new tools had to be developed to rapidly annotate, transcribe, analyze, and visualize salient patterns of behavior and interaction. Results of this analysis comprise human movement traces, word birth places, and social networks, see map. For most children, language development is steady, progressive, and to a casual observer effortless. But for some children—those with developmental delays due to biological or environmental causes— language is a major developmental hurdle. Understanding the regularities in home environments is essential to understanding mechanisms of language acquisition, causes of delay, and ultimately appropriate intervention procedures. http://scimaps.org Dissect and code Black Box WHEN? WHERE? Melodyne by Celemony http://www.celemony.com/cms WHAT? Linguistic Analysis Or Brilliant Minions … WITH WHOM? WHY? Type of Analysis vs. Level of Analysis Micro/Individual (1-100 records) Meso/Local (101–10,000 records) Macro/Global (10,000 < records) Statistical Analysis/Profiling Individual person and their expertise profiles Larger labs, centers, universities, research domains, or states All of NSF, all of USA, all of science. Temporal Analysis (When) Funding portfolio of one individual Mapping topic bursts in 20-years of PNAS 113 Years of Physics Research Geospatial Analysis (Where) Career trajectory of one individual Mapping a states intellectual landscape PNAS publciations Topical Analysis (What) Base knowledge from which one grant draws. Knowledge flows in Chemistry research VxOrd/Topic maps of NIH funding Network Analysis (With Whom?) NSF Co-PI network of one individual Co-author network NIH’s core competency 4 Needs-Driven Workflow Design using a modular data acquisition/analysis/ modeling/ visualization pipeline as well as modular visualization layers. Börner, Katy (2010) Atlas of Science. MIT Press. 5 Börner, Katy. (March 2011). Plug-and-Play Macroscopes. Communications of the ACM, 54(3), 60-69. Video and paper are at http://www.scivee.tv/node/27704 6 Designing “Dream Tools” scientists keen to observe and comprehend what no one has seen or understood before. Galileo Galilei (1564–1642) Many of the best micro-, tele-, and macroscopes are designed by recognized the potential of a spyglass for the study of the heavens, ground and polished his own lenses, and used the improved optical instruments to make discoveries like the moons of Jupiter, providing quantitative evidence for the Copernican theory. Today, scientists repurpose, extend, and invent new hardware and software to “macroscopes” that may solve both local and create global challenges. empower me, my students, colleagues, and Plug-and-play macroscopes 100,000 others that downloaded them. 7 Macroscopes Decision making in science, industry, and politics, as well as in daily life, requires that we make sense of data sets representing the structure and dynamics of complex systems. Analysis, navigation, and management of these continuously evolving data sets require a new kind of data-analysis and visualization tool we call a macroscope (from the Greek macros, or “great,” and skopein, or “to observe”) inspired by de Rosnay’s futurist science writings. Macroscopes provide a “vision of the whole,” helping us “synthesize” the related elements and enabling us to detect patterns, trends, and outliers while granting access to myriad details. Rather than make things larger or smaller, macroscopes let us observe what is at once too great, slow, or complex for the human eye and mind to notice and comprehend. Microscopes Telescopes Macroscopes 8 Macroscopes cont. While microscopes and telescopes are physical instruments, macroscopes resemble continuously changing bundles of software plug-ins. Macroscopes make it easy to select and combine algorithm and tool plug-ins but also interface plug-ins, workflow support, logging, scheduling, and other plug-ins needed for scientifically rigorous yet effective work. They make it easy to share plug-ins via email, flash drives, or online. To use new plugins, simply copy the files into the plug-in directory, and they appear in the tool menu ready for use. No restart of the tool is necessary. Sharing algorithm components, tools, or novel interfaces becomes as easy as sharing images on Flickr or videos on YouTube. Assembling custom tools is as quick as compiling your custom music collection. 9 Macroscopes Serve International, Interdisciplinary Scholars Different datasets/formats. Diverse algorithms/tools written in many programming languages. Health Finance Crime Smart Cities Epidemiology 10 OSGi & CIShell CIShell (http://cishell.org) is an open source software specification for the integration and utilization of datasets, algorithms, and tools. It extends the Open Services Gateway Initiative (OSGi) (http://osgi.org), a standardized, component oriented, computing environment for networked services widely used in industry since more than 10 years. Specifically, CIShell provides “sockets” into which existing and new datasets, algorithms, and tools can be plugged using a wizard-driven process. Developers Workflow Alg Alg Users CIShell Wizards Alg CIShell Sci2 Tool Workflow NWB Tool Tool Workflow Workflow Tool 11 CIShell Developer Guide (http://cishell.wiki.cns.iu.edu) 12 CIShell Portal (http://cishell.org) 13 Sci2 Tool – “Open Code for S&T Assessment” http://sci2.cns.iu.edu OSGi/CIShell powered tool with NWB plugins and many new scientometrics and visualizations plugins. Sci Maps GUESS Network Vis Horizontal Bar Graphs Börner, Katy, Huang, Weixia (Bonnie), Linnemeier, Micah, Duhon, Russell Jackson, Phillips, Patrick, Ma, Nianli, Zoss, Angela, Guo, Hanning & Price, Mark. (2009). Rete-Netzwerk-Red: Analyzing and Visualizing Scholarly Networks Using the Scholarly Database and the Network Workbench Tool. Proceedings of ISSI 2009: 12th International Conference on Scientometrics and Informetrics, Rio de Janeiro, Brazil, July 14-17 . Vol. 2, pp. 619-630. Timeline Visualization: Example 15 Sci2 Tool Geo Maps Circular Hierarchy http://sci2.cns.iu.edu http://sci2.wiki.cns.iu.edu 17 Sci2 Tool: Algorithms Preprocessing Modeling Extract Top N% Records Extract Top N Records Normalize Text Slice Table by Line --------------------------------------------Extract Top Nodes Extract Nodes Above or Below Value Delete Isolates --------------------------------------------Extract top Edges Extract Edges Above or Below Value Remove Self Loops Trim by Degree MST-Pathfinder Network Scaling Fast Pathfinder Network Scaling --------------------------------------------Snowball Sampling (in nodes) Node Sampling Edge Sampling --------------------------------------------Symmetrize Dichotomize Multipartite Joining --------------------------------------------Geocoder --------------------------------------------Extract ZIP Code Random Graph Watts-Strogatz Small World Barabási-Albert Scale-Free TARL Analysis Network Analysis Toolkit (NAT) Unweighted & Undirected Node Degree Degree Distribution --------------------------------------------K-Nearest Neighbor (Java) Watts-Strogatz Clustering Coefficient Watts Strogatz Clustering Coefficient over K --------------------------------------------Diameter Average Shortest Path Shortest Path Distribution Node Betweenness Centrality --------------------------------------------Weak Component Clustering Global Connected Components --------------------------------------------Extract K-Core Annotate K-Coreness --------------------------------------------HITS Weighted & Undirected Clustering Coefficient Nearest Neighbor Degree Strength vs Degree Degree & Strength Average Weight vs End-point Degree Strength Distribution Weight Distribution Randomize Weights --------------------------------------------Blondel Community Detection --------------------------------------------HITS Unweighted & Directed Node Indegree Node Outdegree Indegree Distribution Outdegree Distribution --------------------------------------------K-Nearest Neighbor Single Node in-Out Degree Correlations --------------------------------------------Dyad Reciprocity Arc Reciprocity Adjacency Transitivity --------------------------------------------Weak Component Clustering Strong Component Clustering --------------------------------------------18 Sci2 Tool: Algorithms cont. -------------------------------Extract K-Core Annotate K-Coreness -------------------------------HITS PageRank Weighted & Directed HITS Weighted PageRank Textual Burst Detection Visualization Scientometrics GnuPlot GUESS Image Viewer --------------------------------------------Radial Tree/Graph (prefuse alpha) Radial Tree/Graph with Annotation (prefuse beta) Tree View (prefuse beta) Tree Map (prefuse beta) Force Directed with Annotation (prefuse beta) Fruchterman-Reingold with Annotation (prefuse beta) --------------------------------------------DrL (VxOrd) Specified (prefuse beta) --------------------------------------------Horizontal Bar Graph Circular Hierarchy Geo Map (Circle Annotation Style) Geo Map (Colored-Region Annotation Style) Science Map (Circle Annotation) Remove ISI Duplicate Records Remove Rows with Multitudinous Fields Detect Duplicate Nodes Update Network by Merging Nodes --------------------------------------------Extract Directed Network Extract Paper Citation Network Extract Author Paper Network --------------------------------------------Extract Co-Occurrence Network Extract Word Co-Occurrence Network Extract Co-Author Network Extract Reference Co-Occurrence (Bibliographic Coupling) Network --------------------------------------------Extract Document Co-Citation Network Soon: Database support for ISI and NSF data. 19 Network Extraction: Examples Author co-occurrence network Paper-author 2-mode network 20 Network Visualization: Example 21 Network Visualization: Example 22 Sci2 Tool Adoption The Sci2 Tool is used by NSF, NIH, USDA, and private foundations. Upcoming Tutorial: Sci2: A Tool of Science of Science Research and Practice Instructor: Time/Date: Place: Audience: Cost: Register: Dr. Katy Börner, Indiana University 8:30a-11:30a on Oct 17, 2011 Room II-555 in NSF's Stafford Place II Conference Center, 4121 Wilson Boulevard, Arlington, Virginia 22230, USA This tutorial is designed for researchers, practitioners, program staff from federal agencies interested to use advanced data mining algorithms and visualizations in their work and daily decision making. Free. Registration by Oct 10, 2012 required. Please use http://www.surveymonkey.com/s/MVC8LWW to register by Oct 10, 2012. NSF will issue visitor badges. 23 Network Workbench Tool http://nwb.slis.indiana.edu The Network Workbench (NWB) tool supports researchers, educators, and practitioners interested in the study of biomedical, social and behavioral science, physics, and other networks. In February 2009, the tool provides more 169 plugins that support the preprocessing, analysis, modeling, and visualization of networks. More than 50 of these plugins can be applied or were specifically designed for S&T studies. It has been downloaded more than 89,000 times since December 2006. Herr II, Bruce W., Huang, Weixia (Bonnie), Penumarthy, Shashikant & Börner, Katy. (2007). Designing Highly Flexible and Usable Cyberinfrastructures for Convergence. In Bainbridge, William S. & Roco, Mihail C. (Eds.), Progress in Convergence - Technologies for Human Wellbeing (Vol. 1093, pp. 161-179), Annals of the New York Academy of Sciences, Boston, MA. 24 Computational Proteomics What relationships exist between protein targets of all drugs and all disease-gene products in the human protein–protein interaction network? Yildriim, Muhammed A., Kwan-II Goh, Michael E. Cusick, Albert-László Barabási, and Marc Vidal. (2007). Drug-target Network. Nature Biotechnology 25 no. 10: 1119-1126. 25 Computational Economics Does the type of product that a country exports matter for subsequent economic performance? C. A. Hidalgo, B. Klinger, A.-L. Barabási, R. Hausmann (2007) The Product Space Conditions the Development of Nations. Science 317, 482 (2007). 26 Computational Social Science Studying large scale social networks such as Wikipedia Second Sight: An Emergent Mosaic of Wikipedian Activity, The NewScientist, May 19, 2007 Computational Epidemics Forecasting (and preventing the effects of) the next pandemic. Epidemic Modeling in Complex realities, V. Colizza, A. Barrat, M. Barthelemy, A.Vespignani, Comptes Rendus Biologie, 330, 364-374 (2007). Reaction-diffusion processes and metapopulation models in heterogeneous networks, V.Colizza, R. Pastor-Satorras, A.Vespignani, Nature Physics 3, 276-282 (2007). Modeling the Worldwide Spread of Pandemic Influenza: Baseline Case and Containment Interventions, V. Colizza, A. Barrat, M. Barthelemy, A.-J. Valleron, A.Vespignani, PloS-Medicine 4, e13, 95-110 (2007). 29 Europe OSGi/CIShell Adoption Europe USA A number of other projects recently adopted OSGi and/or CIShell: Cytoscape (http://cytoscape.org) Led by Trey Ideker at the University of California, San Diego is an open source bioinformatics software platform for visualizing molecular interaction networks and integrating these interactions with gene expression profiles and other state data (Shannon et al., 2002). MAEviz (https://wiki.ncsa.uiuc.edu/display/MAE/Home) Managed by Jong Lee at NCSA is an open-source, extensible software platform which supports seismic risk assessment based on the Mid-America Earthquake (MAE) Center research. Taverna Workbench (http://taverna.org.uk) Developed by the myGrid team (http://mygrid.org.uk) led by Carol Goble at the University of Manchester, U.K. is a free software tool for designing and executing workflows (Hull et al., 2006). Taverna allows users to integrate many different software tools, including over 30,000 web services. TEXTrend (http://textrend.org) Led by George Kampis at Eötvös Loránd University, Budapest, Hungary supports natural language processing (NLP), classification/mining, and graph algorithms for the analysis of business and governmental text corpuses with an inherently temporal component. DynaNets (http://www.dynanets.org) Coordinated by Peter M.A. Sloot at the University of Amsterdam, The Netherlands develops algorithms to study evolving networks. SISOB (http://sisob.lcc.uma.es) An Observatory for Science in Society Based in Social Models. As the functionality of OSGi-based software frameworks improves and the number and diversity of dataset and algorithm plugins increases, the capabilities of custom tools will expand. Macroscope “Dream Tools” That Serve International, Interdisciplinary Scholars Common algorithm/tool pool Easy way to share new algorithms Workflow design logs Custom tools TexTrend EpiC Converters NWB Sci2 IS CS Bio SNA Phys 31 HUBzero® is a platform for scientific collaboration and sharing of data, software, and educational materials on the web. http://hubzero.org References Börner, Katy, Chen, Chaomei, and Boyack, Kevin. (2003). Visualizing Knowledge Domains. In Blaise Cronin (Ed.), ARIST, Medford, NJ: Information Today, Volume 37, Chapter 5, pp. 179-255. http://ivl.slis.indiana.edu/km/pub/2003-borner-arist.pdf Shiffrin, Richard M. and Börner, Katy (Eds.) (2004). Mapping Knowledge Domains. Proceedings of the National Academy of Sciences of the United States of America, 101(Suppl_1). http://www.pnas.org/content/vol101/suppl_1/ Börner, Katy, Sanyal, Soma and Vespignani, Alessandro (2007). Network Science. In Blaise Cronin (Ed.), ARIST, Information Today, Inc., Volume 41, Chapter 12, pp. 537607. http://ivl.slis.indiana.edu/km/pub/2007-borner-arist.pdf Börner, Katy (2010) Atlas of Science. MIT Press. http://scimaps.org/atlas Scharnhorst, Andrea, Börner, Katy, van den Besselaar, Peter (2011) Models of Science Dynamics. Springer Verlag. 33 All papers, maps, tools, talks, press are linked from http://cns.iu.edu CNS Facebook: http://www.facebook.com/cnscenter Mapping Science Exhibit Facebook: http://www.facebook.com/mappingscience
