Effects of grazing and habitat use of cattle in the... management of the Zwin salt marsh (Belgium).
advertisement
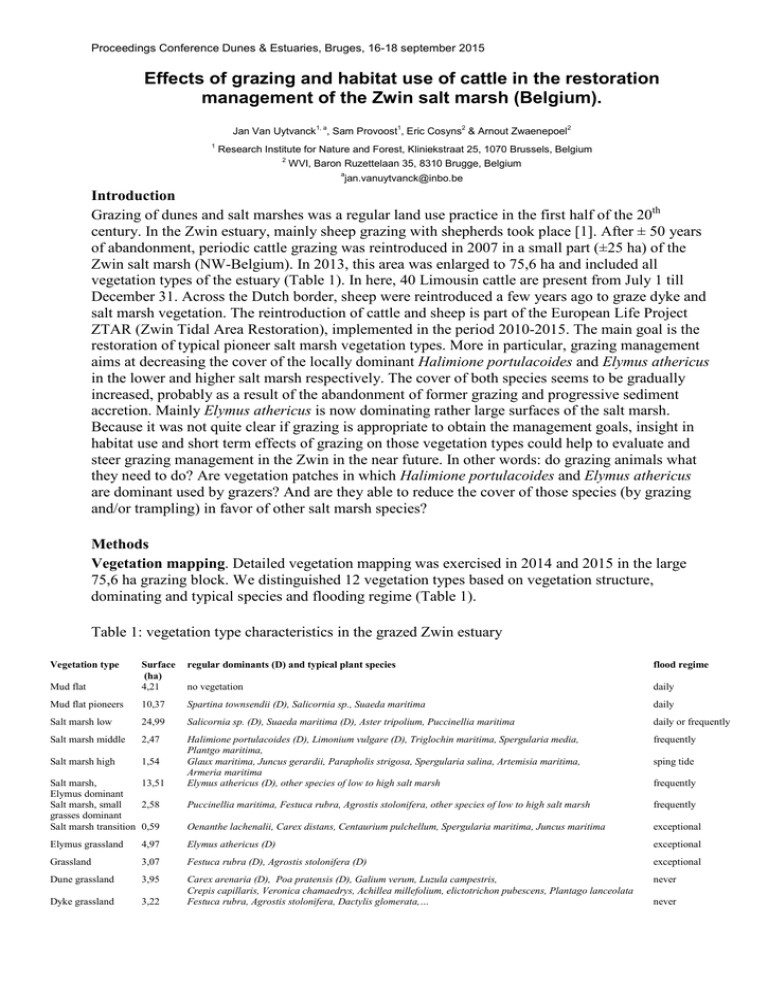
Proceedings Conference Dunes & Estuaries, Bruges, 16-18 september 2015 Effects of grazing and habitat use of cattle in the restoration management of the Zwin salt marsh (Belgium). Jan Van Uytvanck1, a, Sam Provoost1, Eric Cosyns2 & Arnout Zwaenepoel2 1 Research Institute for Nature and Forest, Kliniekstraat 25, 1070 Brussels, Belgium 2 WVI, Baron Ruzettelaan 35, 8310 Brugge, Belgium a jan.vanuytvanck@inbo.be Introduction Grazing of dunes and salt marshes was a regular land use practice in the first half of the 20th century. In the Zwin estuary, mainly sheep grazing with shepherds took place [1]. After ± 50 years of abandonment, periodic cattle grazing was reintroduced in 2007 in a small part (±25 ha) of the Zwin salt marsh (NW-Belgium). In 2013, this area was enlarged to 75,6 ha and included all vegetation types of the estuary (Table 1). In here, 40 Limousin cattle are present from July 1 till December 31. Across the Dutch border, sheep were reintroduced a few years ago to graze dyke and salt marsh vegetation. The reintroduction of cattle and sheep is part of the European Life Project ZTAR (Zwin Tidal Area Restoration), implemented in the period 2010-2015. The main goal is the restoration of typical pioneer salt marsh vegetation types. More in particular, grazing management aims at decreasing the cover of the locally dominant Halimione portulacoides and Elymus athericus in the lower and higher salt marsh respectively. The cover of both species seems to be gradually increased, probably as a result of the abandonment of former grazing and progressive sediment accretion. Mainly Elymus athericus is now dominating rather large surfaces of the salt marsh. Because it was not quite clear if grazing is appropriate to obtain the management goals, insight in habitat use and short term effects of grazing on those vegetation types could help to evaluate and steer grazing management in the Zwin in the near future. In other words: do grazing animals what they need to do? Are vegetation patches in which Halimione portulacoides and Elymus athericus are dominant used by grazers? And are they able to reduce the cover of those species (by grazing and/or trampling) in favor of other salt marsh species? Methods Vegetation mapping. Detailed vegetation mapping was exercised in 2014 and 2015 in the large 75,6 ha grazing block. We distinguished 12 vegetation types based on vegetation structure, dominating and typical species and flooding regime (Table 1). Table 1: vegetation type characteristics in the grazed Zwin estuary Vegetation type regular dominants (D) and typical plant species flood regime Mud flat Surface (ha) 4,21 no vegetation daily Mud flat pioneers 10,37 Spartina townsendii (D), Salicornia sp., Suaeda maritima daily Salt marsh low 24,99 Salicornia sp. (D), Suaeda maritima (D), Aster tripolium, Puccinellia maritima daily or frequently Salt marsh middle 2,47 frequently Salt marsh high 1,54 Halimione portulacoides (D), Limonium vulgare (D), Triglochin maritima, Spergularia media, Plantgo maritima, Glaux maritima, Juncus gerardii, Parapholis strigosa, Spergularia salina, Artemisia maritima, Armeria maritima Elymus athericus (D), other species of low to high salt marsh Puccinellia maritima, Festuca rubra, Agrostis stolonifera, other species of low to high salt marsh frequently Oenanthe lachenalii, Carex distans, Centaurium pulchellum, Spergularia maritima, Juncus maritima exceptional Salt marsh, 13,51 Elymus dominant Salt marsh, small 2,58 grasses dominant Salt marsh transition 0,59 sping tide frequently Elymus grassland 4,97 Elymus athericus (D) exceptional Grassland 3,07 Festuca rubra (D), Agrostis stolonifera (D) exceptional Dune grassland 3,95 never Dyke grassland 3,22 Carex arenaria (D), Poa pratensis (D), Galium verum, Luzula campestris, Crepis capillaris, Veronica chamaedrys, Achillea millefolium, elictotrichon pubescens, Plantago lanceolata Festuca rubra, Agrostis stolonifera, Dactylis glomerata,… never Habitat use. A GPS-collar registered the position of one cow every 15 minutes during the whole grazing season of 2014 (July 1 - December 31). Earlier studies and own observations allow to assume that one animal represents the average behaviour of the whole herd (± 40 cows). The resulting position records (>17000) were plotted on the vegetation map in a GIS (Arcmap 10). Grazer density per vegetation type was calculated using a 5x5m grid with the dominating vegetation types assigned to each grid cell. We further calculated habitat preference using the Jacob’s index [2] and the number of positions related to the distance (0-1100m) to fresh water supply and height above sea level. Paired vegetation relevés. We used a set of 34 paired vegetation relevés (2 x 2 m, September 2015) in grazed and ungrazed conditions along - but at a minimal distance of 5 m to - the cattle fence. Each pair was situated in the same vegetation type at the same height (using a digital height model of the Flanders Geographical Information Agency. Paired relevé analysis focused on the area that is grazed since 2013 because it was difficult to locate comparable plots in the area grazed since 2007. We measured vegetation height, total vegetation cover and species abundance and cover. We compared cover of E. athericus and H. portulacoides in grazed and ungrazed plots. Additionally and in the same way, we used 30 paired relevés (August 2015) along a fence in the Dutch part of the Zwin estuary where sheep grazing occurs. Results and discussion GPS-data analysis revealed a clear preference for grass dominated vegetation types. Salt marsh vegetation types were avoided, except the high salt marsh and grass dominated salt marsh types (including those dominated by E. athericus) (Figure 1). Dune grasslands and grass dominated salt marshes were even highly preferred. Preference for nutritive grasses may be expected, but preliminary observations on forage behavior since September 2015 confirm that cattle also often eat E. athericus that is known as a rather low nutritive species. Figure 1. Habitat preference of cattle in the Zwin estuary using Jacobs’s index: no preference: -0,08< index <0,08; avoidance: -0,4< index < -0,08; strong avoidance: -1< index <-0,4; preference: 0,08< index <0,4; strong preference: 0,4< index <1. D = dominant The preference for dune grassland may partly be explained by the presence of the only drinking pond in the dune area (Figure 2). Correction of position numbers using available surface on a certain distance strongly emphasizes the importance of fresh water supply. The drinking pond is visited every day. The analysis also revealed a high preference for the grazing block’s edges. Probably the fence is used as a distinctive object, allowing cattle to orientate themselves when moving to other feeding or resting patches. Further, more than 95 % of all positions was found above the average high tide level, suggesting a strong avoidance of vegetation or food plants that are daily flooded with salt water. Paired relevés didn’t show clear differences in vegetation height, total cover or species richness of vascular plant species between ungrazed and grazed (both cattle and sheep) plots. In plots with dominance of E. athericus (n=18), cattle grazing reduced the cover with almost 40 % in a time span of 2 years (Figure 3A). In these cattle grazed plots, we found mainly establishment of Suaeda maritime. Figure 2. Number of GPS positions related to the distance to fresh water supply (pond) The effect of sheep grazing (n=10) was less pronounced (Figure 3B). We could not find a similar effect on H. portulacoides cover, but plots with strong dominance of this species were absent. There were no differences between cattle grazed and ungrazed plots (Figure 3C). In sheep grazed plots, cover of H. portulacoides was significantly lower (Figure 3D). However it was mentioned by shepherd Koen Pille that the species is avoided by sheep. Cover reduction might be also a consequence of trampling. This phenomenon was also locally observed in the cattle grazing block. Figure 3. Cover of E. athericus and H. portulacoides in paired ungrazed and grazed plots Conclusions We conclude that grazing management is a promising restoration measure for the Zwin salt marsh. Cattle preferentially use grassland types and salt marsh habitats dominated by E. athericus and other grasses. On the short term cattle reduced significantly the cover of E. athericus, but establishment of a considerable number of salt marsh species failed to come. In contrast to cattle plots, H. portulacoides cover was reduced in sheep grazed plots. Probably, grazing management needs some more years to yield clear effects. Further, carefully locating fresh water supply has a high potential to steer habitat use and change in salt marshes. References [1] Cosyns E, Lambrechts J, Provoost S, Van Braeckel A, Van Colen C, Verbelen D & Zwaenepoel A, 2015. Monitoring van het ZTAR Life+ natuurherstel in het Zwin 2011-2015. Eindrapport WVI, INBO, Natuurpunt en Universiteit Gent i.o.v. Agentschap voor Natuur en Bos, Provinciale dienst West-Vlaanderen. [2] Jacobs J, 1974. Quantitative measurement of food selection. A modification of the forage ratio and Ivlev’s selectivity index. Oecologia 14, 413-417.
