Stat 511 Homework 5 - corrected Spring 2013 Due: 5pm Friday, 15 Feb
advertisement
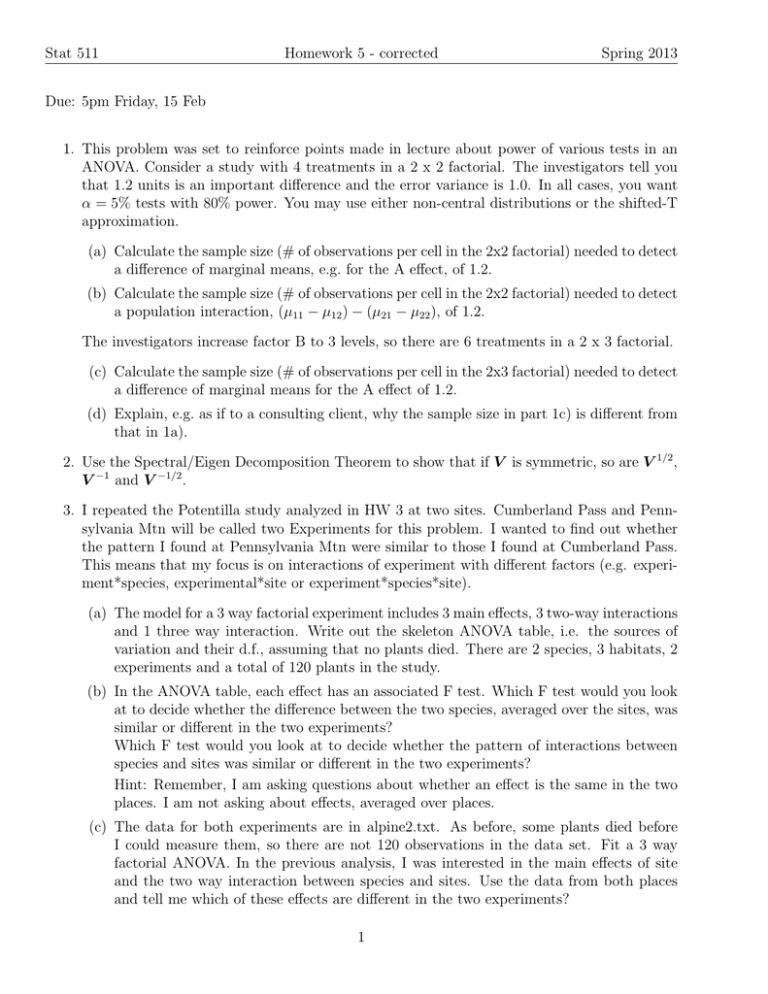
Stat 511 Homework 5 - corrected Spring 2013 Due: 5pm Friday, 15 Feb 1. This problem was set to reinforce points made in lecture about power of various tests in an ANOVA. Consider a study with 4 treatments in a 2 x 2 factorial. The investigators tell you that 1.2 units is an important difference and the error variance is 1.0. In all cases, you want α = 5% tests with 80% power. You may use either non-central distributions or the shifted-T approximation. (a) Calculate the sample size (# of observations per cell in the 2x2 factorial) needed to detect a difference of marginal means, e.g. for the A effect, of 1.2. (b) Calculate the sample size (# of observations per cell in the 2x2 factorial) needed to detect a population interaction, (µ11 − µ12 ) − (µ21 − µ22 ), of 1.2. The investigators increase factor B to 3 levels, so there are 6 treatments in a 2 x 3 factorial. (c) Calculate the sample size (# of observations per cell in the 2x3 factorial) needed to detect a difference of marginal means for the A effect of 1.2. (d) Explain, e.g. as if to a consulting client, why the sample size in part 1c) is different from that in 1a). 2. Use the Spectral/Eigen Decomposition Theorem to show that if V is symmetric, so are V 1/2 , V −1 and V −1/2 . 3. I repeated the Potentilla study analyzed in HW 3 at two sites. Cumberland Pass and Pennsylvania Mtn will be called two Experiments for this problem. I wanted to find out whether the pattern I found at Pennsylvania Mtn were similar to those I found at Cumberland Pass. This means that my focus is on interactions of experiment with different factors (e.g. experiment*species, experimental*site or experiment*species*site). (a) The model for a 3 way factorial experiment includes 3 main effects, 3 two-way interactions and 1 three way interaction. Write out the skeleton ANOVA table, i.e. the sources of variation and their d.f., assuming that no plants died. There are 2 species, 3 habitats, 2 experiments and a total of 120 plants in the study. (b) In the ANOVA table, each effect has an associated F test. Which F test would you look at to decide whether the difference between the two species, averaged over the sites, was similar or different in the two experiments? Which F test would you look at to decide whether the pattern of interactions between species and sites was similar or different in the two experiments? Hint: Remember, I am asking questions about whether an effect is the same in the two places. I am not asking about effects, averaged over places. (c) The data for both experiments are in alpine2.txt. As before, some plants died before I could measure them, so there are not 120 observations in the data set. Fit a 3 way factorial ANOVA. In the previous analysis, I was interested in the main effects of site and the two way interaction between species and sites. Use the data from both places and tell me which of these effects are different in the two experiments? 1 Stat 511 Homework 5 - corrected Spring 2013 Hint: You do not need to look at estimates here, just figure out which which are the appropriate tests and tell me the conclusions. Include F statistics and p-values for each test. 4. The file fracFact.txt contains the coded (+1 / -1) treatments and response Y for a 21 fraction of an unreplicated 25 treatment design, i.e. is a 25−1 treatment design. I have provided values of each main effect and each 2 way interaction. (a) Is the main effect of x2 confounded with any other effect in the design matrix? Tell which effect(s) are confounded and explain why or why not. Is the main effect of x2 confounded with any effect not currently in the design matrix, e.g. a 3-, 4-, or 5-way interaction? Tell which effect(s) are confounded and explain why or why not. (b) Is the x2 × x3 two-way interaction confounded with any effect, either in or not currently in the design matrix? Tell which effect(s) are confounded and explain why or why not. (c) Use a normal probability plot to identify the non-zero effects in the model. Report which effects are non zero. For non-zero effect, estimate the difference between High and Low levels of the factor or interaction. (d) Estimate σ 2 by pooling information from the non-significant factors and interactions. Note: This is a different estimator than the MSE, so this estimate will not match the MSE when fitting a model with just the “significant” effects. (e) Identify the difference(s) between the estimator given in the notes and the MSE when fitting a model with just the “significant” effects. Note/Hint: The variance of β̂ for any column of the X matrix is σ 2 /N , where N is the number of rows of data. My philosophy of statistics has emphasized estimates of things (even though we spend more time talking about tests and p-values). I am not unique in this. I found the following text in Box, Hunter and Hunter, Statistics for Experimenters, 2nd ed., p 188. The title of the section is “Misuse of the ANOVA for 2k factorial experiments”. Many computer programs employ the ANOVA for the analysis of the 2k designs . . .. However, for the analysis of these particular designs, the use of the ANOVA is confusing and makes litte sense. Consider the analysis of a two-level design with k factors in n replications and hence N = n × 2k observations. In the ANOVA approach, the 2k −1 degress of freedom for treatments are partitioned into individual “sums of squares” for effects, equal to N (effect)2 /4 . . .. Thus, instead of seeing the effect (y i − y . ) itself, the investigator is presented with N (effect)2 /4, which must then be referred to an F table with one degree of freedom. There is nothing to justify this complexity other than a misplaced believe in the universal value of an ANOVA table. What the experiment wants to know is the magnitude of the effect, (y i − y . ), its standard error, and the ratio t =Effect/SE(effect). 2
