Stat 301 – Fall 2015 - HW 10 answers
advertisement
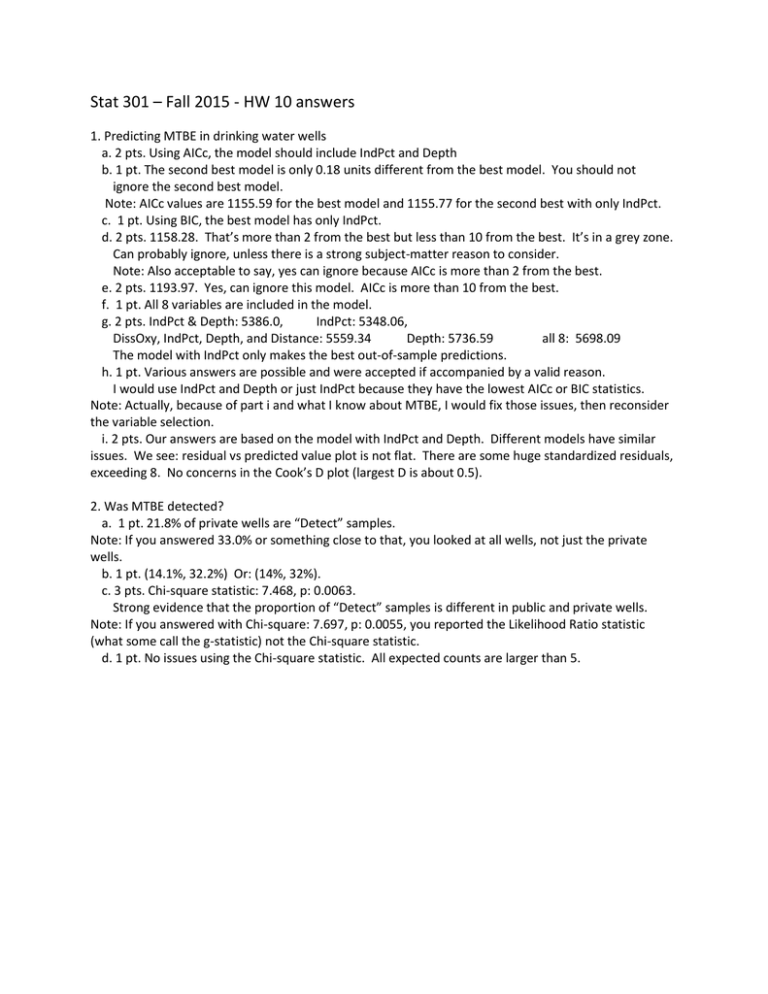
Stat 301 – Fall 2015 - HW 10 answers 1. Predicting MTBE in drinking water wells a. 2 pts. Using AICc, the model should include IndPct and Depth b. 1 pt. The second best model is only 0.18 units different from the best model. You should not ignore the second best model. Note: AICc values are 1155.59 for the best model and 1155.77 for the second best with only IndPct. c. 1 pt. Using BIC, the best model has only IndPct. d. 2 pts. 1158.28. That’s more than 2 from the best but less than 10 from the best. It’s in a grey zone. Can probably ignore, unless there is a strong subject-matter reason to consider. Note: Also acceptable to say, yes can ignore because AICc is more than 2 from the best. e. 2 pts. 1193.97. Yes, can ignore this model. AICc is more than 10 from the best. f. 1 pt. All 8 variables are included in the model. g. 2 pts. IndPct & Depth: 5386.0, IndPct: 5348.06, DissOxy, IndPct, Depth, and Distance: 5559.34 Depth: 5736.59 all 8: 5698.09 The model with IndPct only makes the best out-of-sample predictions. h. 1 pt. Various answers are possible and were accepted if accompanied by a valid reason. I would use IndPct and Depth or just IndPct because they have the lowest AICc or BIC statistics. Note: Actually, because of part i and what I know about MTBE, I would fix those issues, then reconsider the variable selection. i. 2 pts. Our answers are based on the model with IndPct and Depth. Different models have similar issues. We see: residual vs predicted value plot is not flat. There are some huge standardized residuals, exceeding 8. No concerns in the Cook’s D plot (largest D is about 0.5). 2. Was MTBE detected? a. 1 pt. 21.8% of private wells are “Detect” samples. Note: If you answered 33.0% or something close to that, you looked at all wells, not just the private wells. b. 1 pt. (14.1%, 32.2%) Or: (14%, 32%). c. 3 pts. Chi-square statistic: 7.468, p: 0.0063. Strong evidence that the proportion of “Detect” samples is different in public and private wells. Note: If you answered with Chi-square: 7.697, p: 0.0055, you reported the Likelihood Ratio statistic (what some call the g-statistic) not the Chi-square statistic. d. 1 pt. No issues using the Chi-square statistic. All expected counts are larger than 5.


