Stat 301 HW 5 Due: 9 Oct / 12 Oct 2015
advertisement
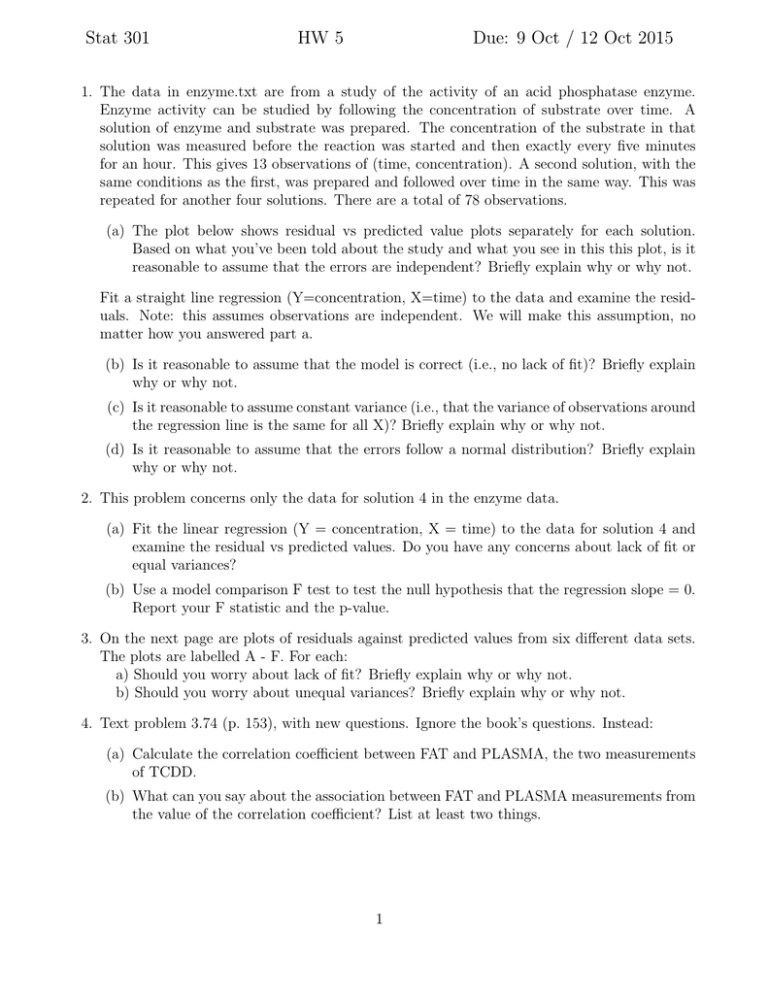
Stat 301 HW 5 Due: 9 Oct / 12 Oct 2015 1. The data in enzyme.txt are from a study of the activity of an acid phosphatase enzyme. Enzyme activity can be studied by following the concentration of substrate over time. A solution of enzyme and substrate was prepared. The concentration of the substrate in that solution was measured before the reaction was started and then exactly every five minutes for an hour. This gives 13 observations of (time, concentration). A second solution, with the same conditions as the first, was prepared and followed over time in the same way. This was repeated for another four solutions. There are a total of 78 observations. (a) The plot below shows residual vs predicted value plots separately for each solution. Based on what you’ve been told about the study and what you see in this this plot, is it reasonable to assume that the errors are independent? Briefly explain why or why not. Fit a straight line regression (Y=concentration, X=time) to the data and examine the residuals. Note: this assumes observations are independent. We will make this assumption, no matter how you answered part a. (b) Is it reasonable to assume that the model is correct (i.e., no lack of fit)? Briefly explain why or why not. (c) Is it reasonable to assume constant variance (i.e., that the variance of observations around the regression line is the same for all X)? Briefly explain why or why not. (d) Is it reasonable to assume that the errors follow a normal distribution? Briefly explain why or why not. 2. This problem concerns only the data for solution 4 in the enzyme data. (a) Fit the linear regression (Y = concentration, X = time) to the data for solution 4 and examine the residual vs predicted values. Do you have any concerns about lack of fit or equal variances? (b) Use a model comparison F test to test the null hypothesis that the regression slope = 0. Report your F statistic and the p-value. 3. On the next page are plots of residuals against predicted values from six different data sets. The plots are labelled A - F. For each: a) Should you worry about lack of fit? Briefly explain why or why not. b) Should you worry about unequal variances? Briefly explain why or why not. 4. Text problem 3.74 (p. 153), with new questions. Ignore the book’s questions. Instead: (a) Calculate the correlation coefficient between FAT and PLASMA, the two measurements of TCDD. (b) What can you say about the association between FAT and PLASMA measurements from the value of the correlation coefficient? List at least two things. 1 ● 1.5 ● ●● ● ● ●● ● −1.0 ● ●● 6 ● ● ● ●● ● ● ● 8 10 12 14 ● predict(m1) ● ●● 8 ● ● ● ● ● ● ● ● 10 ● ● ●● ● 12 ● ● ● ● ● ● 0.5 15 20 ● ● ● ● ● ● ● ● ● ● ● ●● ● ● ● ● ● ● ● 2 3 4 1.0 predict(m4) ● ●● ● ● ● ● ●● ● ● ● ● −1.0 ● ● 8 ● ●● ● ● ● ● ● ● 0.0 ● ● ● 6 ● ● F resid(m6) ● ● ● 0.5 0.0 −0.5 ● 30 ● 1 ● ● ● 25 predict(m2) ●●● ● ● ●● ●●● ● ● ● ● ● ● ● predict(m3) ● ● ● ● ●● ● ● ● ● ● 14 ● ● ●● ● ● ● ● ● E ●● ●● ● ● ● −0.5 ● 6 ● ● ● ● D ● ● −2 0 2 ● ● ● ● ● ●● ● ●● ●●● ● ● ● ● ●●● ● ● ● ● ●● ● ● resid(m4) 4 C ● ● ● ● ●● −0.5 ●● ● ● ●● ● ● ● ●● ● ● ● ● ● ● ● ●● ● ● ● −1.5 ● ● ● ● ●●● ● ● ● ● 1.0 ● ● ● ● ● ● ● 0.5 0.0 ● ● ● ●● ● resid(m2) 1.0 ● B 0.0 A 10 12 14 6 2 ● ● 8 10 12 14 ● ●
